[I confess: this is a hybrid post in which I have broken the golden rule of 'knowing my audience'. As a result, you may well choose to read only part of it. The opening few paragraphs speak of my experience in the planning and presentation of a talk on astrophotography to a non-expert audience. After a couple of tiny footnotes you'll get to two appendices. The first of these was written in response to requests to provide a synopsis of the above talk; it includes a lot of links to various packages etc. So far, so good. The second appendix was added as a note of my parallel struggles trying to get a replacement laptop to run all my astrophotography needs in the way my rapidly-fading older one did; it's distinctly nerdy and is also replete with links.]
Showing posts with label U3A. Show all posts
Showing posts with label U3A. Show all posts
Wednesday, 13 March 2024
Saturday, 14 October 2023
House of (more) Treasures
In a recent post (here) I waxed lyrical on the subject of my first visit to the Canterbury Cathedral Library and Archives: “[sitting] at a desk surrounded by old wood with light filtering in through handmade glass, and to hear at one point the cathedral’s bells drifting through high ceilings”. I have now embarked on a six-session u3a course in the history of printing in Europe, led by Dr David Shaw, so get to spend even more time there. Such a joy.
The course itself, which is proving to be a delight, has thrown up several nuggets of information to be nestled in the memory, awaiting their time. For instance, did you know that the terms ‘lower case’ and ‘upper case’ derive from the days when a compositor – the person who set each letter of a font in place in order that a page might be printed using a manual printing press – had to select the next letter in a given word: their font cases were arranged such that the more common letters, ‘e’ for example, were close at hand (literally in the lower of the usual arrangement of two font cases) and those less commonly required, capital ‘Z’ perhaps, were in the more distant or upper case. When working with the speed allowed by ‘muscle memory’ this could save a lot of time and effort, rather like touch-typing – a skill I have, regrettably, never properly acquired. It’s no wonder the apprenticeship lasted seven years. This would often be followed by a period as a ‘journeyman’ during which the person would travel to various printing works in order to expand their experience and expertise. The size of a font was also defined at this stage, with 72-point corresponding to one inch (1″) – thus, a 12pt font corresponds to letter/number heights that fit within 1/6th of an inch or a little over 4 mm. This was, evidently, an early example of industrial standardisation; paper sizes were similarly standardised.
However, my principal focus in this post is to mention one of the books that David thoughtfully made available for us to marvel at during our mid-session break: Robert Boyle’s 1660 work on what we would now think of as air pressure and the like. Robert Boyle was a founding member of the Royal Society and made seminal contributions to the physical sciences; indeed, the slightly younger (but perhaps nowadays more famous) Isaac Newton used some of Robert Boyle’s work in order to derive an equation for the speed of sound in air. It is a personal pleasure to be able to turn the pages of this beautiful book; moreover, in a straw poll of the twelve other u3a members with me on this course, I discovered several people had retained a memory of hearing about ‘Boyle’s Law’ from their school days – a testament to his legacy.
 |
Having discovered – whilst drafting the earlier blog post referred to above – the extent of the time and energy required of the Cathedral’s hard-pressed Archive & Library staff to generate and supply images of old documents in their collection, I was delighted to find online a ready-made image of another copy of the this very book. The above title page and example illustration comes courtesy of the Science History Institute and is made available under Creative Commons Public Domain Mark 1.0 Universal. |
 |
| Reproduced from a document on David's website (here). |
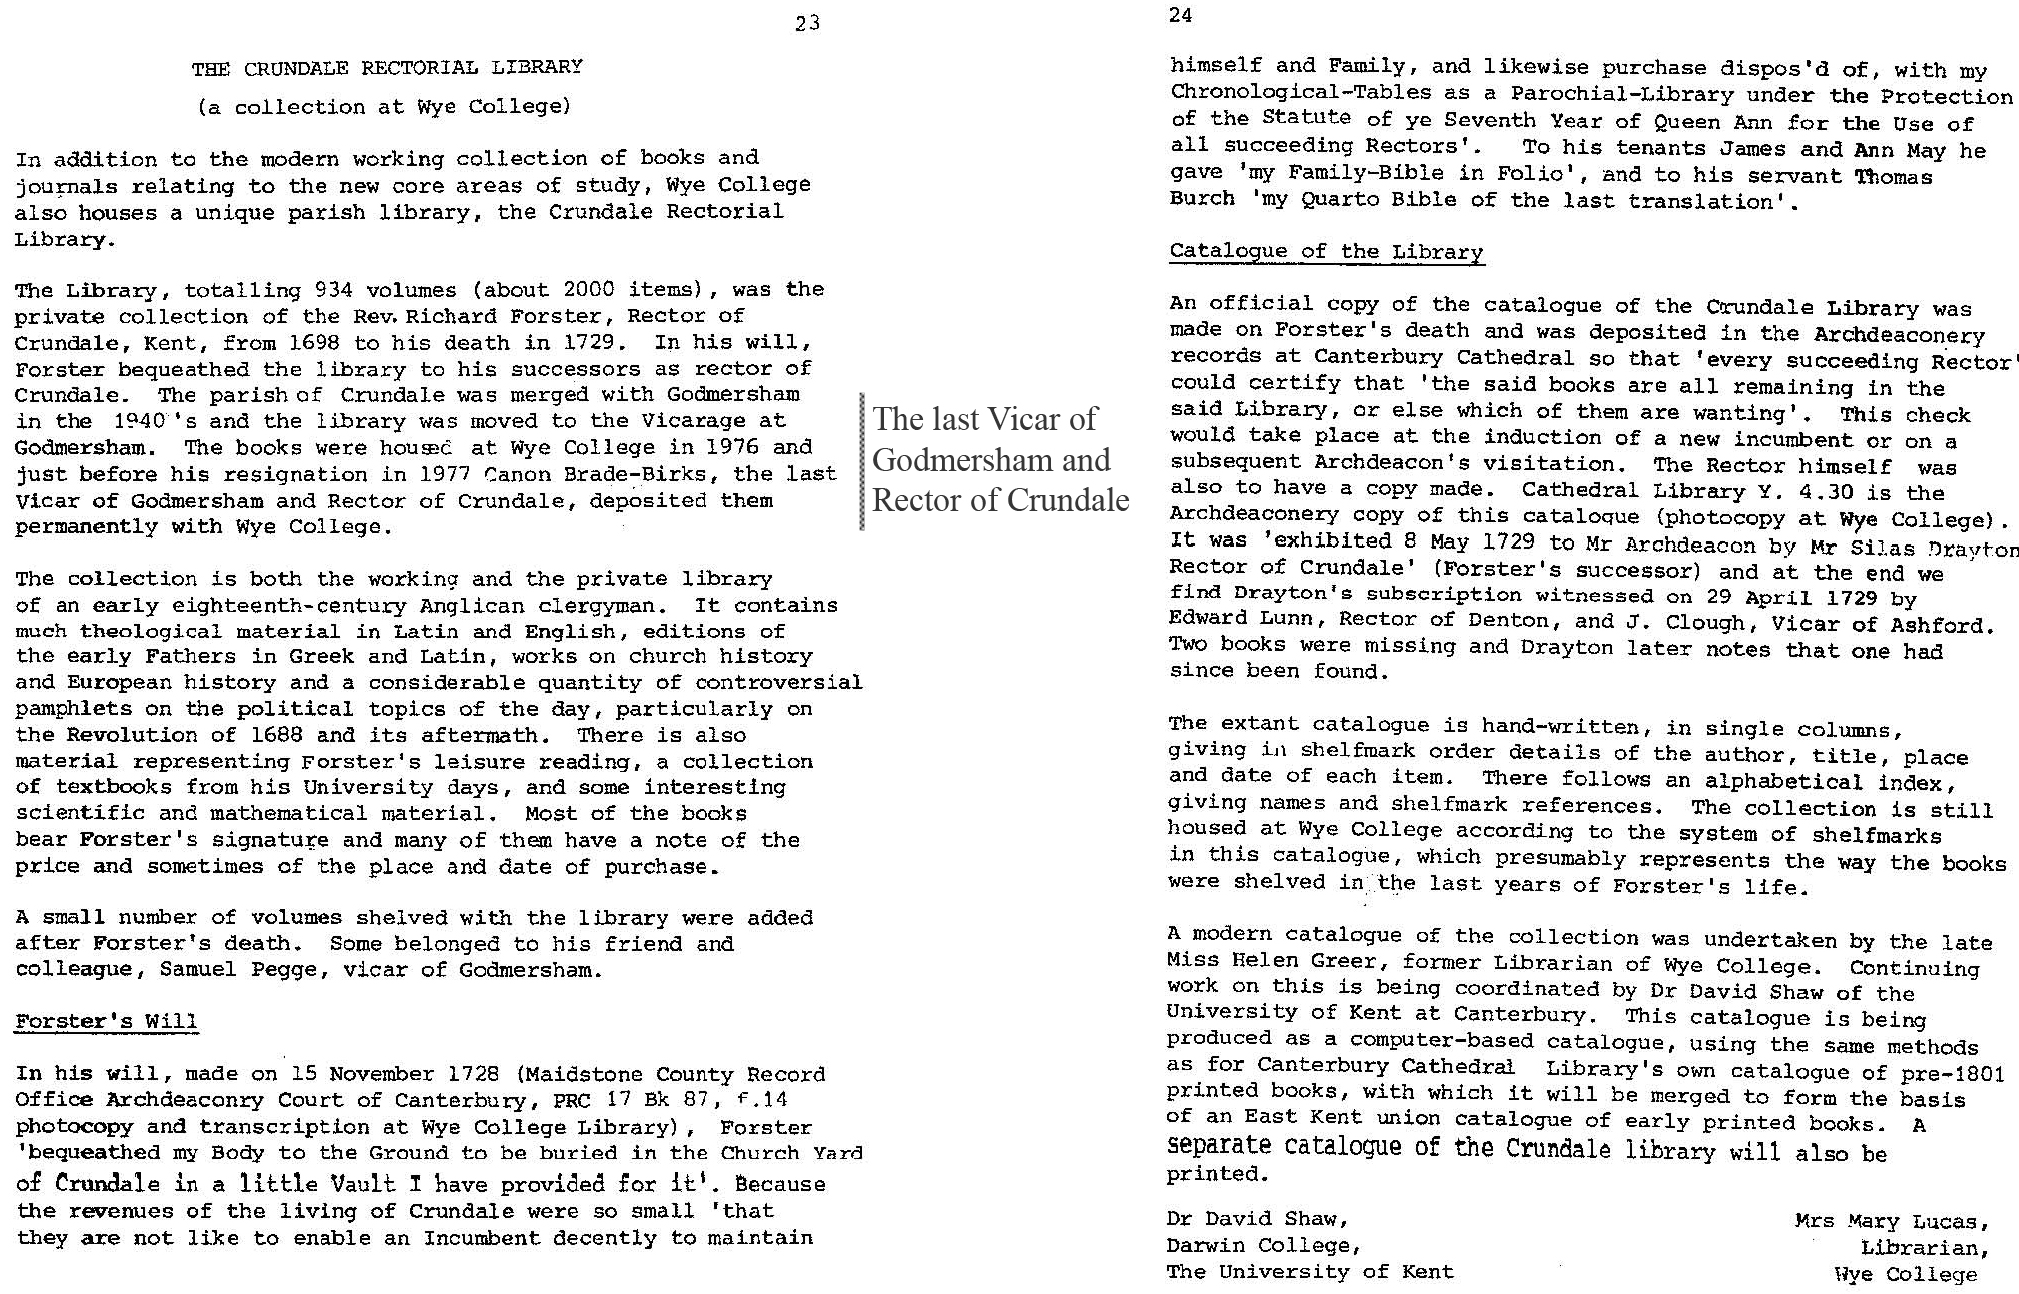
The vicarage was situated just outside the boundary wall of Godmersham Park which, as her fans will know, has a close connection with the writer Jane Austin. It also commanded enviable views across the River Stour and as a result of this proximity and its age, suffered from damp at ground level; its library was accessed via an impressive spiral staircase. My parents-in-law lived in the Godmersham parish; indeed, my father-in-law served as churchwarden for fifty years. Moreover, my wife and I were married in Godmersham church in the late 1970s. The wedding was conducted by the then Vicar/Rector, Canon Graham Brade-Birks – who has been mentioned with affection in a previous post on this blog site, here. I’m pretty sure that he was already eligible for retirement when he conducted our wedding service but he was a man with the clear conviction of his calling, and retirement was postponed for as long as was practicable. However, after he eventually retired, the vicarage was sold (to ‘someone in television’ as I recall) in order to raise funds for the Church of England and there followed an extended interregnum: there was, therefore, no successor to whom the library’s contents could be passed. Thus, although non-stipendiary (unpaid, usually part-time) vicars/rectors were subsequently appointed, Canon Brade-Birks was indeed, in effect, the last of the line. Hoping to ensure the survival of the library’s contents, he left it to the nearby Wye Agricultural College where he had taught the odd course on soil science. (I have also written a post mentioning Wye College, where I was employed for a year after leaving school – see here). At the time, the College was a constituent part of the University of London. It was later subsumed into Imperial College and then closed and sold off; the collection that had been looked after by Canon Brade-Birks was eventually handed into the care of Canterbury Cathedral’s Archive & Library.
As I admitted, this is a tenuous link. For such links I am, however, grateful.
Wednesday, 2 August 2023
House of Treasures
One morning at the end of June I was sitting at a desk in Canterbury Cathedral’s Archives reading room. This was my first time in the Library/Archives, despite having lived and worked within a few miles of the place since 1985; it had taken the kind invitation of historian and retired academic Dr David Shaw – mentioned in my previous post – to bring about a much overdue visit. In front of me were all three volumes of Isaac Newton’s seminal work on the mathematics that govern so much of the observable universe; a work which, quite literally, redefined the way we understand our the world. Rarely have I touched such valuable documents. However, this is a digression and I shall relegate it to a postscript below*. This post is primarily about glass: specifically, glassmaking in England at the time of the Tudors and Stuarts ...
 |
| This is the ‘Proclamation touching Glasses’ (reference CCA CC/A/P/P/1/PR/48) at the heart for my visit to the Cathedral Archives. Unusually, but rather wonderfully in my opinion, Canterbury Cathedral Archives also holds and manages the city archives of Canterbury: were that not the case I may never have had this rare opportunity. (Sadly, a set of records relating to the county, being the archive of the Diocese of Canterbury, was removed from the collection some ten years ago and is now held by Kent County Council in the County Town of Maidstone.) The images shown above were created for me by the Cathedral Archives and are used with the kind permission of the Chapter of Canterbury. |
 |
| The Tudor rose and the thistles in this illustrated opening letter ‘I’ tie the origin of the proclamation firmly to its period. |
All in all, I had a wonderful few hours in the Archives. The welcome I received was second to none and the ‘atmosphere’ in there came pretty close to defining my dream library environment. To sit at a desk surrounded by old wood with light filtering in through handmade glass, and to hear at one point the cathedral’s bells drifting through high ceilings was bliss.
My warmest thanks go to David Shaw for his thoughtful invitation, to the two Archives reading room staff who registered me and settled me in, to their Digitisation Officer for creating digital images of the proclamation and to the Archives and Library Manager who approved my request to show the images in this post and offered some valuable comments on an earlier draft.
* Postscript: Turning the pages of Isaac Newton’s Philosophiæ Naturalis Principia Mathematica (1687; ‘The Mathematical Principles of Natural Philosophy’, see here and here) was a very special treat for anyone with an interest in science, and particularly for a physicist like me. Isaac Newton laid the groundwork for so much of the physical sciences still taught in schools and colleges: an intellectual giant. The text of the Principia was written in Latin, which I cannot read, but Newton and I share a common second language: that of mathematics. I only had time on this visit to enjoy the first of the three-volume work, but that proved ideal in the sense that I could focus properly on the many pages Newton used to define his terms and establish key axioms and proofs. Thus, I could discern that he used ‘C’ for speed, ‘S’ for distance and ‘T’ for time and would write the classic relationship between them as C = S : T (c.f. the c = s/t form one would see today). Moving from there to acceleration, momentum etc. became possible on this basis. Noticeably, there is much space given to the use geometric proofs. There are other historic scientific documents held within the Archive and now that I have my reader’s photo-ID card I shall be able to book a slot for return visits.
P.p.s. One afternoon, back in 1985/6, together with a couple of colleagues who were similarly bored of the mandatory ‘induction course’ we’d been dispatched to by our employer, I got the chance to look through several historical documents in the library at Herstmonceux Castle – including a beautifully illustrated contemporary account of James Cook’s first expedition on the Endeavour. As a schoolboy I don’t believe I ever committed truancy – I loved learning, so why would I – but I have no regrets about skipping class on that occasion ;-)
Further reading
There are a great many books/articles on the history of glass. For those with an interest in the glassmaking of England during the period of history of most relevance to this blog post I can share a few of the online resources I have consulted:
On early-modern glass
For an extended article on the history of glassmaking in England – including the use of wood and switch to coal see here.
On the scientific analysis of medieval glass (a PhD thesis).
For Historic England’s archaeological guidelines see here and also here and here.
There are other, more generic, books sitting on my shelves such as:
‘5000 Years of Glass’ edited by H. Tait (The British Museum Press, 2012; ISBN 978-0-7141-5095-6)
‘A Short History of Glass’ by Cloe Zerwick (Harry N. Abrams Inc., 1990; ISBN 0-87290-121-1)
‘The Glass Bathyscaphe’ by A. Macfarlane and G. Martin (Profile Books, 2003; ISBN 1-86197-394-2).
‘5000 Years of Glass’ edited by H. Tait (The British Museum Press, 2012; ISBN 978-0-7141-5095-6)
‘A Short History of Glass’ by Cloe Zerwick (Harry N. Abrams Inc., 1990; ISBN 0-87290-121-1)
‘The Glass Bathyscaphe’ by A. Macfarlane and G. Martin (Profile Books, 2003; ISBN 1-86197-394-2).
Friday, 14 July 2023
The Pleiades: of daughters, poets and stars
In a recent post I succumbed to the temptation to issue a
cri de coeur in respect of my
exasperatingly slow progress learning how to capture long-exposure frames,
perhaps of 5-10 minutes duration, of faint astronomical objects like galaxies
and nebulæ. At the tail end of one of my many nights of trials I turned my
telescope towards something easy to identify: M45, the Pleiades, or Seven
Sisters, which is a cluster of mostly faint stars. (A cluster is simply a
relatively large group of stars held by their mutual gravitational attraction.)
By this stage – actually, only about 9 pm on a mid-February evening in 2023 but
it felt much later – I simply wanted something, anything, to show for all my
efforts.
 |
| The image on the left was derived from the best 75 of 103 five-second frames. The second image differs only in that I have labelled the stars that have names and have added their visual magnitudes (see explanation below). The field of view here is a square of almost 2° x 2°, so almost four times the apparent size of the Moon or the Sun. For those wanting a little more technical information, I’ve added a footnote [1]. |
I had never thought of employing
these less-than-dramatic images as the basis for a blog post until using them
for one of the short ‘science-lite’ pieces I write for my local u3a’s Facebook group. In its turn, this was mentioned in a comment I made on a FB
post (see here) on star clusters within our own galaxy, the Milky Way, posted by my
ex-colleague Dr Dirk Froebrich (who runs the Beacon Observatory and its
excellent HOYS ‘Citizen Science’ programme).
Dirk kindly ran the Pleiades star cluster through the software he’s been using
and this added an interesting new level to my simple image. Shortly after, my
fellow u3a tutor Dr David Shaw told me about a group of 16th century
French Renaissance poets who called themselves La Pléiade. They, in their turn, were named after an analogous
group of seven 3rd century BCE Alexandrian poets who took their name
– the Pleiad – from our star cluster.
We end up in Greek mythology with the seven daughters of Pleione (literally,
the Pleiades); these Seven Sisters had names you’ll see reflected in the labelled image
above: Maia, Electra, Taygete, Alcyone, Celaeno, Sterope and Merope. Their
mother joins them, as does another mythological figure claiming Pleione as his
mother: Atlas. Taken together, these additional layers of information were
enough to coax me to the keyboard. [Since originally posting this in mid-July the u3a's Astronomy Advisor, Martin Willock, has shared a link to an article in 'The Conversation' from December 2020 that I hadn't seen; it offers additional insight into ancient mythology surrounding The Pleiades, including that of Aboriginal Australians. See also this piece, which I add in June 2024.]
Occasionally, if the muse is insistent, I might dare to try my hand at free-form or shape/concrete poetry (see
here for my very first attempt) but I make no claims whatsoever regarding my (lack
of) poetic ability or understanding. Similarly, although in my youth I read
translations of the Iliad, Odyssey and Aeneid – copies of which still sit on a
shelf in my study – I claim no depth to my knowledge of Greek mythology. I
think it wise to avoid straying too far from the scientific theme at the heart
of my blog so, even though I am merely an amateur astronomer and
astrophotographer, I will focus on this aspect.
Let’s start with an explanation of the other designation I gave in my opening paragraph for this cluster of stars: the Pleiades and the Seven Sisters are covered, but what of M45? Charles Messier was a French astronomer with a special interest in the discovery of new comets. There were, however, objects that might look a little like a comet in a small telescope but which could be ruled out on closer study since, unlike a comet, they moved exactly as a star would in the night sky. One of Messier’s important contributions to comet discovery was the compilation of a list of these non-cometary objects. His catalogue, the final version of which was published in 1781 and which contained 103 of such objects, enabled fellow comet-hunters to avoid ‘wasting their time’. Messier-45, or M45 – the Pleiades – is simply the 45th entry in his catalogue of things not to bother with if one is trying to spot a comet. Ironically, his ‘avoid’ list has become a ‘to do’ list for many amateur astronomers. This is perhaps especially so for those who prefer astrophotography to visual observation and wish to produce their own images of visually fascinating objects beyond our solar system like nebulæ, supernova remnants and galaxies. In my own case, although I do aspire to capturing a few such images, there’d be no point in saddling myself with such a demanding checklist at my age ;-)
Look them up in books, apps or online and you’ll be told that the Pleiades can be seen with the naked eye within the constellation of Taurus (see diagram below, a screenshot from a piece of free software called Stellarium). Actually, that’s only really true in the absence of significant light pollution since it's a relatively faint cluster of stars. Even under good observing conditions one can usually only pick it out in the corner of one’s eye. This is because, whilst our central vision is great for detail and colour it’s not so good on faint objects – for these we’re better off letting the light fall on the off-centre parts of the retina where the receptors don’t permit a sharply resolved image but are better suited to low light levels. The standard advice is to ‘look away a little’ whilst remaining aware of what’s in the periphery of your vision.
 |
| Stellarium is not the only useful navigation aid for the night sky, but it’s certainly a very good one. This view is approximately 60° across, so a small fraction of the 360° horizon; it is the view towards the West as it would have been in mid-February 2023 at about 21:30. The Pleiades is indicated by my arrows. By the way, in
Japan the cluster is referred to by a different name: Subaru, which mean ‘unite’. Furthermore, the Pleiades (along with Orion) get a mention in two of the books of the Old Testament - Job, which probably dates to the fifth or sixth centuries BC, and Amos, which refers to events at around 750 BC. |
Despite its common name of the Seven Sisters, there are about 1000 stars in the cluster although most are too faint for all but the most powerful telescopes to pick out. Even the brightest stars in the cluster are still relatively faint. The brightness of celestial objects is measured on a scale of apparent magnitudes: a counter-intuitive scale on first sight that has the faintest objects assigned the highest numbers. Each step of 1 on the apparent magnitude scale corresponds to a change in perceived brightness by a factor of 2½ (see footnote [2] for more detail). Thus, bright Venus has a magnitude of -4.7 at the time of writing but much fainter Polaris, the Pole Star, is +2 and this actually means that Venus appears to us more than one hundred times as bright as Polaris. Our eyes can, on a clear night and without too much light pollution, see stars ‘down to’ a magnitude of about 5 or 6; at my age and with the excessive street lighting near my house it’s definitely more 5 than 6 – probably even m = 4! So it's no surprise that the Pleiades are difficult to pick out without a bit of technology since even the brightest of them reaches only 2.8 in magnitude (Alcyone). However, the variation in magnitudes within this faint cluster gave me a means to check out the detection limits of my telescope and astrocamera. It’s apparent that, even with a total of only 6¼ minutes of light-gathering, I can detect stars with a magnitude approaching 10; I’m content with that.
We come now to the clever bit, and something totally new to me until a couple of weeks ago when I read the post by Dr Dirk Froebrich I mentioned above. Dirk and his team are using data from the European Space Agency’s Gaia telescope to identify clusters of young stars within the Milky Way. The Gaia project is progressing with its aim to measure the distance and motion of 2000 million stars (please see footnote [3] for details). Astronomers like those in Dirk’s team can use its database to check which stars within a telescope’s field of view are actually within a cluster – i.e. grouped by virtue of their mutual gravitational attraction – or simply happen to be in the line of sight. To be part of a cluster our stars ought to be at similar distance from us and they ought to be moving together within the Milky Way, albeit with some small additional ‘random’ motion as the stars orbit the centre of their cluster. What Dirk kindly shared is an application of this methodology to the distances and proper motions of the stars in the part of the night sky that includes the Pleiades; the results are shown below.
 |
| The left hand plot shows the distances of the stars one observes in the part of the sky occupied by the Pleiades – some of which may be a part of the cluster and others may simply be in our line-of-sight. Notice the red-coloured spike indicating those stars at approximately the same distance from Earth, a median distance of 444 ± 1 light years. Sitting at the same distance is however not sufficient to qualify a star as being a member of a cluster as it also needs to have a similar proper motion to other members; i.e. it needs to be moving through space as part of the cluster. The plot to the right gives us that information. It shows, for all those stars in the red-coloured spike, their proper motion in right ascension (the celestial analogue of longitude) and declination (the analogue of latitude). Only those stars with similar values, again represented in red, can be considered to be members of the Pleiades cluster. The Gaia data yields a little more in respect of the Pleiades – indeed, all the stars it has measured – in that one may plot the colour of its constituent stars against its absolute magnitude and generate a Hertzsprung–Russell diagram, which gives an indication of the stars’ ages, but I have relegated this to yet another footnote, [4]. |
Apart from the fun I’ve had in writing this, I’ve learnt once again that there’s always more to see than the obvious: I’ve known of the Pleiades since my first forays into stargazing as a teenager, now I treasure them as a sight even more. It’s also caused me to consider afresh the facts I took for granted when writing about some of the binary star systems I’ve imaged in the past (e.g. here and here). Thanks for reading J
~1750 words + footnotes
Footnotes:
[1] The 3k x3k pixel image is defined by my
Altair Astro 533c astrocamera (4 fps, sensor at -5° C, gain=400, dark level=192;
no calibration frames) on a Skywatcher 72ED refractor fitted with a 0.8x
reducer/flattener; the telescope was mounted on a Skywatcher HEQ5 GoTo mount
controlled from my elderly laptop by Carte du Ciel via ASCOM. The mount was
polar aligned (i.e. to the celestial pole, which is close to Polaris, the Pole
Star) using a plate-solving routine included in SharpCap – this is what facilitated
exposures as long as 5s. Image capture was handled using SharpCap, with the
best frames, i.e. a total integration time of only 6¼ minutes, stacked initially
using DeepSkyStacker – my first trial of this software – and then using PIPP
and Autostakkert3. The image was processed using my old version of Photoshop.
[2] 2.512 to be a little more precise, or to get
it entirely correct it’s 5√100
– the fifth root of 100 – which means that a star of apparent magnitude 1, m1,
will appear one hundred times as bright as a star of m6. For a full description
of both absolute magnitudes (M) and the apparent magnitude (m) scale I’ve mostly used
in this post see here.
[3] Distances are determined using measurements
of parallax, i.e. the apparent change of position of an object against its
background as the observer changes position. (Try holding your thumb at arm’s
length and use it to hide a distant object like a TV aerial or street sign
whilst one eye is closed; now switch to the other eye and notice the apparent
shift in the object’s position relative to its background: that’s parallax.) In
the case of Gaia’s measurements of stars, the analogue to switching between
eyes is to conduct a pair of measurements six months apart – so on opposite sides
of the Earth’s orbit around the Sun. What comes out of these measurements is a
parallax angle, and thence corresponding Earth-star distances – calculated
using trigonometry on the basis of the diameter of the Earth’s orbit being the
base of an isosceles triangle – are usually quoted in Parsecs (pc), which is
approximately the same as 3.26 light years (ly). For a fuller explanation, see here or here. Determining the motion of our candidate stars requires that one follows their
positions relative to the cosmic background over time; astronomers refer to a
star’s ‘proper motion’.
[4] The colour of a star is a pretty good proxy for its surface temperature (- think about metal being heated, glowing increasingly bright red as the temperature rises until appearing ‘white hot’) and its magnitude may be used instead of its luminosity. So, by plotting a graph of colour against magnitude we’re in effect plotting temperature against luminosity and that can tell astronomers/astrophysicists a lot about the age distribution of stars in a cluster. (There is additional information here and here.) The plot Dirk obtained indicates that the stars which constitute the Pleiades formed no more than 200 Myr ago; the online resources I looked at before drafting this post (e.g. here and here) suggest a figures of 100 Myr ranging up to 150 Myr depending on the stellar evolution model adopted – so that’s a reasonable match.

Monday, 12 June 2023
Videos: the gap between teaching and learning
Two years after I retired I stepped back into the hobby I had enjoyed as a schoolboy but had felt obliged to set aside in favour of ‘getting on with life’. (There’s a whole blog series buried in that phrase, but it’ll not be written by me … unless some of my earlier posts, like this one, cover some of those bases.) I’d been saying for years and years that I missed it and had long declared that I would spend a fraction of my pension pay-out in order to get the telescope that I’d always wanted as a teenager. With hindsight, a useful rejoinder might have been “be careful what you wish for”.
Cutting a long and convoluted story short (more details here should you wish to know; if you’re having trouble sleeping there are also a few updates*) I finally put my money where my schoolboy aspiration lay and bought a 150 mm Newtonian reflector from a local supplier, which sat beautifully upon a sturdy tripod and equatorial mount. Patrick Moore would have used the old-style measurement of six inches back when I was a kid watching ‘Sky at Night’ on a low resolution monochrome TV – this was the size he’d recommended and it had evidently lodged in my mind for more than half a century. It was lovely; so much fun. I spent the first hours of many a clear night gazing through it at all those objects I’d struggled to see using my original tiny pocket-money telescope. However, the more I gazed the more my aspirations grew. Unfortunately, the associated challenges seemed at times to expand even faster.
 |
| Here it is: one of the most fun presents I’ve ever treated myself to, fresh out of the box and assembled indoors awaiting better weather, and darkness. |
The core issue was that I wanted to capture images of what I was looking at, and in the process to go beyond the limitations of my eyes – which the attributes of a superbly flexible short focal length ‘camera’, but limited by a relatively inefficient light capture mechanism. I tried to use my smartphone, but with limited success. The next step was to persuade family members to buy me an entry-level astronomical camera as a Christmas present – but that also necessitated retro-fitting motorized drives to my equatorial mount and loading (and learning to run) a whole family of software packages on my PC. All this software requires effort if it is to be used to the full and it was at this point that my attempts to learn from blog sites and YouTube began.
“YouTube is your friend” was a mantra cited by several people at my local amateur astronomy society. (Sadly, their meetings are held at a venue which is over an hour’s drive away: a journey I don’t attempt these days, although I can get to the much closer Beacon Observing Group - but that's not quite the same thing.) There’s certainly a lot of relevant material there, along with copious bite-sized snippets of advice on astronomy-related Facebook groups and the like (e.g. Altair Astro's). I muddled through on this basis and in the process collected a few pleasing images of major solar system objects, along with a few binary star systems. I still haven’t captured an image of Mercury, but that’s another story. However, this learning curve was insignificant compared to the issues associated with my deeper aspiration of capturing images of nebulæ within the Milky Way and more particularly images of other galaxies. Another telescope, a computerized mount and a second astrocam were required. Actually, a pair of telescopes was needed: a small one to piggy-back on the main ’scope in order to control the mount so that the main telescope+astrocam holds the target object steady in the field of view for extended periods of time. This is where the limitations of trying to learn something from online sources really kicked in since the technical demands on setting up the assembled equipment are severe and the slew of new software to get to grips with (and to get in communication with the equipment!) is prodigious. There is so much to learn and to master; even if astrophotography was my only hobby or commitment I would struggle to set aside enough time.
 |
| This is the ‘new’ setup – actually, both the telescope and the astrocam (the larger of the two purple cylinders where otherwise an eye might be) were purchased second-hand from trustworthy people – photographed during a session of daytime astronomy whilst imaging sunspot clusters. Getting used to the new kit in the light was extremely useful, although it can never resolve the issues associated with long-exposure imaging. (It's taken me by surprise a little bit how difficult I'm finding this given that I spent an entire career writing and using complex software in order to handle large datasets and get something meaningful out the other side. An acquaintance - himself an experienced astronomer and astrophotographer with his own observatory - recently described it as being 'rocket surgery'; he's not wrong. Perhaps it's an age thing ...) |
Online is usually the only place to go for information since ‘deep sky’ astrophotography is intrinsically a solo pursuit (i.e. suitable for introverts). Having said that, there are a handful of people who have offered useful bespoke advice via email or similar - people like Ewan who I met at the local astronomy society I mentioned earlier, and like Alex at First Light Optics. Nevertheless, I’d dearly love to have an experienced person nearby who’d be willing to spend an evening or two giving me a tutorial – but even those few I know with a nearby postcode use different kit and more importantly, different software packages. So, I’m back online again.
This is probably true of all hobbies, but search for topics in ‘astrophotography’ on YouTube and you’ll be met with an ocean of suggested videos, many of which have words like ‘beginners’ and ‘tutorial’ in their titles. They are tags I have learnt not to rely on. For every instructional video that tackles beginners’ issues well – i.e. none of those frustrating missed steps or the use of jargon etc. – one might have waded through another five that confuse or even demotivate. On some topics I have failed to find a single video that addressed my questions and therefore that I’d recommend to another struggling beginner. Don’t get me wrong, I admire and am grateful to these people for at least making the effort. Moreover, most of their videos contain nuggets of useful information and I’m confident that, should I ever move on from my present inexperienced state, some will be of use as I seek to progress further. I’m also acutely aware of my own limitations, having uploaded many hours of physics-related video material during the more severe phases of the COVID pandemic. These were notionally aimed at my local u3a (University of the Third Age) and specifically for those with a non-science background: see here and also here. I have already been told by a couple of people that I ‘lost’ them in some instances – for them, at the very least, I failed to deliver. I had attempted to teach something, but those viewers had not been able to learn from the material I supplied. That’s down to me, not to them. Thus, even someone like me who used to teach for a living – and do it well by most accounts# – found it difficult. It was easier when I was in the lecture theatre, face-to-face with students and thus able to fine-tune my words in real-time as I responded to the learners in front of me. Such responsiveness is simply not possible when limited to the one-shot nature of a YouTube video and its analogues. Or is it …?
These reflections have suggested to me a way forward which might work were it practicable – which, unfortunately, it probably isn’t without time-consuming effort, coordination and sponsorship. What if one were able to bring together an experienced practitioner and one or two (or more) beginners and film the interaction as our expert got the beginners up-and-running. The expert has the resources needed and the beginners will keep the pace and details at an appropriate level. If none of them has simultaneously to handle the filming/editing process then such matters as line-of-sight, clarity of shots, sound levels etc. can better be assured. Thus, we have a team effort; expensive of time etc. but potentially better able to generate something of worth. Of course, this would be a long series of videos since one would need to cover a wide spectrum of tasks using various combinations of equipment and software.
It’s a dream, nothing more.
______________________________________________________________
* here, oh and here and also here ;-)
# Please forgive me if this sounds boastful. In truth, I have never felt completely satisfied with my skill as a teacher and I know I have made mistakes, but I look back on decades of complimentary feedback from students and can smile nevertheless at a job done to the best of my ability.
Friday, 26 February 2021
Experimenting within the Third Age: ‘flipped lectures’
Four years BP (Before Pandemic) and soon enough after
retirement that I could still remember the details of my life in salaried work,
I wrote about some of the ‘experiments’ in education I was fortunate enough to
be able to pursue (see here for example, final couple of paragraphs). I find that I am still succumbing to this
weakness for trying new approaches in science communication. My intended
audience is now the membership of the local branch of the University of theThird Age, U3A , rather than undergraduate students, but the passion to share my love of the
life scientific remains the same. This post will offer, I hope, a preliminary
reflection on a new take on an old theme. The rich vein of serendipity evident
to me throughout will also emerge if I can string the right words together.
 |
| Cartoon by Jon Butterworth - used with permission. |
Although my first 2020 ‘lockdown’ project was actually fairly conventional in many ways – a vaguely straightforward presentation of some basic Physics, albeit tied to objects one might very well find in the home – it did expand my experience of video creation/editing and the use of YouTube. I also learnt how to perch a small whiteboard on the lap and keep it level and in the frame without getting muscle pain and how simultaneously to control a handful of coloured marker pens as they attempted an escape. Such were the skills associated with 2020. A previous blog post provided an overview to the videos and formed, in essence, a Contents Page for the series (you will find it here). Curiously, given the crudity of the setup and my naïvety as a speaker-to-camera (I generally prefer to be behind the lens) this initial blog post has become the most viewed of them all. Having got to the end of my imagination, or perhaps simply my energy – it’s hard to say when in the midst of the stresses and strains of pandemic life – I turned to something more prosaic: making the few surviving recordings of my pre-retirement lectures available via YouTube (see here for details). The potential audience for this particular video series was never going to be large.
In early summer the call came for ideas and proposals for the
approaching 2020/21 U3A Autumn & Spring Programme, none of which would take
place face-to-face of course. Whilst everyone had ‘made do’, after a fashion,
when the pandemic’s grip had first been felt and the second half of 2019/20’s
programme had to be cancelled, actually starting a new year without even the remotest
possibility of face-to-face meetings seemed worse somehow. My fellow
science-based tutors and I ran monthly Q&A/Forum sessions via Zoom on a selection
of topics, which went down very well. (I’m glad that I had suggested it earlier
in the year, but the truth is that it was my friend and local U3A Science
Coordinator, Alan Chadwick, who actually got it up and running successfully; I
doubt I could have done so well.) However, this didn’t address the need/demand
for the more focused sessions one would normally expect to lead. Some of these
could be handled ‘live’ via Zoom, and several tutors took this route, but it
didn’t suit the material I had or my presentation style. In particular, it
would be difficult to include the demonstrations I try to weave into my
sessions. So, without consciously realising it until well after I’d launched myself
into my proposed ‘solution’, I turned to the use of an approach I’d tried
during the final couple of years of my working life based on flipped lectures.
A classic use of this would be to guide students into studying a topic in their
own time – I had recordings of lectures I’d delivered in earlier years
available for them, together with recommended reading etc. – and to follow this
up with face-to-face sessions in which any issues arising from their study
could be ironed out. In my ‘locked down’ variant I hoped to translate my
pre-existing (face-to-face) sessions into videos that I could upload to YouTube
for our U3A members to view as and when convenient. At some point thereafter we’d
schedule a Zoom session so that everyone had the opportunity to engage in
follow-up discussions and to pose whatever questions might have arisen in their
minds.
As with all novel approaches, feedback and proper reflection
are important when trying to assess whether the ‘experiment’ has been a success
or needs a re-think. Questionnaires and their like do not appeal: too
reminiscent of work, and a sure-fire way to dampen enthusiasm. A simpler route
would be to assess the overall demand by looking at the numbers registering for
the Zoom session and comparing them to those typically associated with a
face-to-face session. Then, from the self-selected people who did participate,
one might take a look at the questions posed – what folk actually took away as their
appreciation of the videos’ content as distinct from my naïve intentions – and
any unsolicited feedback. That brings me, at last, to the primary focus of this
post.
Although there were decent access statistics for the blog
post and evidence that the videos had been viewed, the numbers actually
registering and turning up for the follow-on Zoom sessions were relatively
small compared to analogous face-to-face sessions. In a ‘normal’ year one might
see between 20 and 40 U3A members participating, but there were only a dozen or
so at the Zoom sessions. About a quarter of those people sent subsequent
feedback by email – all of which was positive I am glad to say. Likewise, the fact
that several folk had taken the trouble to formulate and submit questions in
advance and/or engaged in the resultant discussion might also be taken as
positive. Having said that, a significant number of the questions posed were
arguably at a tangent to the actual content of the associated videos; in
practice, this doesn’t matter as the topics were fun to discuss: it’s all about
science communication after all, and a little diversion can be instructive.
Taken together, it is reasonable to conclude that the format
of ‘pre-recorded video plus Zoom follow-up’ was not popular amongst the
membership as a whole. However, judging by the feedback received, the brave few
who did embrace the experiment seem to have got something worthwhile from the
experience.
On that basis, and bearing in mind the large investment of
time required, would I seek to offer ‘flipped’ sessions again in the future? Frankly,
given the pandemic-derived impetus for the experiment, I sincerely hope the
question doesn’t arise! The truth of the matter is that I needed a project on
this scale to help fill the year and would almost certainly have proceeded even
if I’d known no-one would turn up; moreover, I enjoyed doing it. Thus, every
one of the lovely U3A members who did engage with my experiment provided a
distinct bonus: each and every one of them rendered my investment worthwhile.
There is a postscript: now that the major part of my pre-existing U3A material is available 24/7 on YouTube I can’t see myself ever presenting it ‘live’ hereafter. This might be considered a negative consequence were it not for the fact that my next U3A project is thereby called into being – to put together some brand new material from scratch; watch this space …
________________________________________________
I append below the feedback I’ve received and the questions submitted in advance by email (in italics) and the few notes I pulled together in case my brain ‘froze’ during the live Zoom sessions. There were plenty of follow-up/'live' questions of course, but I’m not sufficiently skilled at multi-tasking that I could jot all those down whilst also answering them, so only a few are listed below. I promised participants that I’d include all this material in the present post but, unless you particularly want to read it, do feel free to stop at this point.
Feedback
Thank you very much
for this excellent course.
I wondered if we would
be able to have access to these valuable lectures on the internet indefinitely
please, or is there a limited timescale (lifespan?)? [There is no time
limit currently envisaged or planned.]
Thank you so very much
for fascinating videos and this morning’s session on radiation.
This went so much
further than what we learnt as radiotherapy students with the much broader
aspect of the subject so well presented. I am new to U3A and have found the
course content really stimulating with the standard of lectures.
I will be looking up
your other u tube videos.
Thank you for another
really fascinating set of videos and the question and discussion session today.
I missed out on science education when I was at school and have been trying to
fill the gaps ever since.
Thanks for a
fascinating Zoom.
Really enjoyed your
presentation … I've always felt quite comfortable to have my understanding
stretched. Your presentation continued the process especially explaining
gravity as fundamental, pervasive, measurable but not yet fully explained.
There were good further reading hints too ...
Thank you again for
your excellent courses, they make a huge difference.
Your lectures open new
doors of learning, & hopefully understanding, food for the soul & life
enhancing.
I’m enjoying the
videos – at least I appreciate now why you always talk about glasses plural
rather than glass!
Thank you so much for
this talk – fascinating... I hope I didn’t ask too many questions, but I was
riveted.
Questions posed
1) Radiation
What happens to nuclear waste, and will it be a problem long term, or
will we have mastered it safely?
It’s a big question, and a serious
one. One of the ways forward for the high level waste that needs long-term
storage is to incorporate it into a glass. Glasses may be designed to be stable
for thousands of years; if in turn these are enclosed in outer protective
layers and then carefully stored deep underground away from water courses we
are likely to be well protected. There are some exceptionally talented people
involved in the research behind these vitrification processes (e.g. https://twitter.com/@clairecorkhill
Sheffield) See also ukinventory.nda.gov.uk Remember, there is
always risk – it’s a matter of selecting the optimum way forward on the basis
of all available reliable evidence.
Polonium 210 - one of my friends stayed at the London hotel where it
was believed Litvinenko was poisoned. About a week later, he was contacted by
police at his home in Naples, he was asked to submit to a medical, luckily all
clear. Given polonium 210 is an alpha emitter, and apparently was transported
in a flask, how could radiation leak out to contaminate hotel rooms,
aeroplanes?
Po-210 appears to have been
introduced via a cup of tea drunk by Alexander Litvinenko during a meeting with
former associates. Po-210 was finally confirmed as he was nearing death
precisely because it is an alpha emitter and therefore almost ‘invisible’ to a
standard Geiger counter: it took the involvement of specialist scientists with
more sophisticated equipment. Once they were involved the trail of
contamination could be followed back in time. The two poisoners had
contaminated themselves and shared that with items and people around them;
obviously, the table setting in the place he’d drunk the tea was also
contaminated – especially the dregs in the tea cup. Po-210 is only dangerous as
a source of radiation once inside the body, where the alpha radiation kills
living cells as the metal is carried around the body (including to the bladder
– causing more contamination).
If you keep a glass vase coloured with uranium salts long enough (700
million years!) will it lose some of the green colour.
On the face of it the answer is
“yes”, but bear in mind the fact that the decay chain for U-238 takes us, via
intermediaries, to U-235 – an isotope which is of course chemically identical
to its parent isotope. All radioactive isotopes of U have an associated decay
chain but U-238 forms 99.3% of the element, which is why I focused on that in
the slides. Thus, given that the half-life of U-238 is about the age of the
Earth, the colour will fade – but maybe not at a rate one would notice ;-)
How is a GM tube made sensitive to alpha radiation?
The key is to ensure that the end
window is thin and made from something of low density (i.e. relatively few
atoms to get in the way). Whilst gamma rays and the higher energy beta
particles will have no problems entering the gas within the thin-walled tube,
alpha particles will. End windows of mica or occasionally even beryllium
(element 3 in the periodic table, a metal – extremely toxic) are commonly used.
Thus, whilst it’s harder to detect alpha radiation with a G-M tube it’s far
from impossible with the right set-up.
In your demonstration with the various radioactive minerals and
aluminium and lead absorbers you used lead wrapped in plastic. Is there a significant hazard in handling
lead?
Lead is toxic; it affects the nervous
system and has a tendency to stick around in the body for a long time; it’s an
example of heavy-metal poisoning. Lead water pipes began to be phased out
decades ago, and lead additives in fuel were removed during the ‘90s and
outlawed in the EU in 2000. Lead may be absorbed through the skin – hence the
plastic bag.
At a few places in the videos there is a bit of blurring between X-rays
which are electromagnetic radiation but are not produced by radioactive decay
and gamma radiation also em radiation but is. In everyday language the word radiation is applied to many situations
in which the radiation referred to is not nuclear. I think I understand this but wonder if all
your audience do.
This is a good point. ‘Radiation’
may be used of more than one phenomenon; however, at the core of our present
topic is the word as applied to radiation having its origin within the nucleus
of unstable atoms. (The cross-over in the video was, I think, associated with
making the point that gamma rays are themselves electromagnetic in nature – so,
a higher energy analogue to x-rays, which in their turn are higher energy
electromagnetic radiation than the colours we perceive in a rainbow and so on.)
Comment: The nucleus changes during radioactive decay: it’s not that a part of the nucleus is ‘thrown out’ but rather that there’s a change to the nucleus which results in a newly-created entity leaving with the excess energy of the change. (e.g. a nucleus splitting into two, with one being an alpha; a neutron decaying into a proton and an electron, with the electron leaving; a whole nucleus shuffling down to a less excited state by emitting a gamma ray photon)
2) What’s so special about the Earth?
How come we’ve landed up in a highly desirable area (estate agents) as
a third area out from the Sun?
We are able to ask questions like
this because we live on this particular planet – we wouldn’t be around to pose
such questions from Venus or Neptune. There is a major philosophical
theme here.
What pulled the plug out to get rotation going. Why does everything
have to rotate and not stay still.
Early universe: once cool enough
for atoms to form (H, He) they were at high T and therefore moving fast; more
cooling meant that they could clump together (gravity), but all it takes is a
tiny instability in one place to begin to affect all other places around.
Locally, there are also the effects of collisions.
Gravity is a complete mystery to me. Everyone takes it for granted. I
can’t. Want to know more. What is this prime force and how did it start?
The classic description by Newton
tells us that it is a fundamental property of anything that has mass: it’s
intrinsic to the universe. It’s not a strong force and may be dominated by
other effects at short distances (e.g. magnetic, electrostatic) but for large
masses and over long distances it becomes the boss. Einstein’s theories of
Special and of General Relativity offered us a model of space-time which is
curved/distorted and in which we ‘fall downhill’. We feel our weight because
the Earth’s surface is preventing out fall down the slope towards its centre. A
key observation was that the path of photons from distant stars is bent as it
comes close to the Sun. Listen to ‘The Curious Cases of Rutherford and Fry’. (It was at this point in our Zoom session that we engaged in an
extended discussion on the myth of the ‘lone genius’.)
Who names and accepts planet names?
Many different cultures named them
independently. Earth from 8th century Anglo Saxon word ‘Erda’ meaning
ground/soil; Sun – from middle English sunne (Chaucer’s Canterbury Tales).
Planets names from Roman myth. Stars often named from Arabic Polaris has also
been known by the names Alruccabah, Angel Stern, Cynosura, the Lodestar,
Mismar, Navigatoria, Phoenice, the Pole Star, the Star of Arcady, Tramontana
and Yilduz at various times and places by different cultures in human history. Some
things are named after their discoverer: Kuiper belt, Oort cloud. All objects,
bodies and surface features now overseen by the International Astronomical
Union.
Termination shock? Heliosphere: You mentioned it is like a 'shock
wave'. Could you explain a bit please? Is it just the name of a region that has
certain properties or is there something physical there? How much of a barrier
is it? Does it behave as a partial two-way barrier? As I understand it, we do
get some cosmic radiation incident on Earth, as well as particles from the
solar wind.
The term came from a diagram I had
inserted into a slide. Heliopause – when the influence of the Sun (magnetic
field, solar wind) no longer dominates over galactic forces. This might be
thought of as the extent of the Solar System. (The Oort cloud is further out –
held there in orbit by the Sun’s longer-ranged gravitational attraction.)
Can you say more about the creation of the molten core and solid centre
of the Earth?
Early stage of solar system the
planets formed from the gravity-driven) aggregation of gas, and small
particles. As ever-larger clumps collided and coalesced the energy of the
collisions heated everything up – everything from Mercury to Mars began life as
a ball of molten material which then slowly cooled and began to solidify. (The
same is true of the outer planets, but they became large enough that their
gravity could hold on to a lot of gas as well.) In fact proto-Earth was
re-melted in a hugely violent collision with another proto-planet – estimated
to be about the size that Mars is today) – out of this collision came the
debris which formed our relatively huge Moon.
Is there anything similar on Venus, Mars or the Moon?
Mars is relatively small compared
to the Earth, so it has cooled faster but it does still have a molten core –
however, perhaps due to the size, there isn’t the motion required to generate a
magnetic field. Venus is more similar to Earth in size, but it rotates very
slowly (one day on Venus is almost 4 Earth months – in fact its day is slightly
longer than it year) and so we don’t get the motions required for either
tectonic plate movement or a magnetic field.
I was particularly interested in the equation relating to the
likelihood of developed life on a planet in other galaxies. Mostly obvious and
difficult to get your head around the infinity of infinities of possible
galaxies but what I had never thought of before, and should have, is the fact
you have to take time into account too.
That is that life could have existed and finished or maybe not started
yet. So not only the number of galaxies
and planets to consider but also the coincidence of life occurring on one at
the same time as a life form such as humans on earth is capable of making
contact. Not to mention that contact
must be recognisable by the other.
Yes indeed. It sounds as though
you know of the Drake equation (see https://exoplanets.nasa.gov/news/1350/are-we-alone-in-the-universe-revisiting-the-drake-equation/
for example, noting the ‘guesstimates’ required) and the Fermi Paradox (e.g. https://www.forbes.com/sites/startswithabang/2018/06/26/no-we-cannot-know-whether-humans-are-alone-in-the-universe/);
I am content to await evidence.
Age of the Universe: You mentioned about 14 billion years. Has this
been calculated by working backward to the Big Bang and based on current
observations of the expansion rate? Or, is the calculation much more
sophisticated than that? Detail of the maths not required!
We can get a ‘guesstimate’ of the
age simply by reversing the clock on what we currently observe, but there is a
need to be a little more subtle than that. We now know, on the basis of our
expanding body of observations (which have, in effect, taken us back to within
a few million years of the Big Bang), that the rate of expansion was different
in earlier epochs. Consider, for example, the fact that when everything was
closer together the gravitational attraction between masses was greater – so
more tendency to slow the rate of expansion.
(We engaged at this point in a discussion of what the ‘observable
universe’ means, introducing Dark Matter/Energy etc.)
Earth's Magnetic field: I can see why relative motion between a solid
ferrous inner core and molten (ferrous?) outer core will produce a magnetic
field, but how do they think these relative motions might have come about?
Actually, this is a complex
problem: a fuller picture is that the solid inner core (about the mass of the
Moon, but almost all Fe) rotates eastward a little faster than the Earth
overall (it laps the rest of the planet once every 400 years or so) – it gets
this ‘push’ from the action on the Fe of the Earth’s geo magnetic field. This
means that the fluid outer core is travelling. In effect, in a westward
direction compared to the inner core. The magnetic field in created by complex
convection currents in the fluid outer core, and its relative motion compared
to the inner core is what leads to the tendency for the poles to drift over
time. The Fe sank to the centre early on in our history; the inner core is
gradually growing as the Earth slowly cools
Does the vortex in the bath go the same way in the southern hemisphere
as here? Do Runner Beans twine the
same way in Australia as they do in UK ?
(ref Flanders and Swann, The Honeysuckle and the Bindweed)
Yes, no difference – urban myth.
They follow the Sun, wherever they are.
And a bit about Sun Dogs which we see occasionally during our
sundowners on Whitstable beach, and the Northern Lights which we were amazed to
watch from a beach on Sheppey one night a few years ago.
Refraction through hexagonal ice crystals in the upper atmosphere; 22º to either side of the Sun, sometimes with an arc (type of halo).
3) Glass: a look inside – science, technology and art
Please discuss de-colouring agents a little more, specifically
Manganese dioxide added to make greenish glass clear. I did research several years ago on 19th
Century lavender window glass. Manganese
was added to glass to remove the green tinge to glass. But with oxidation/ exposure to sunlight, the
glass windows turned lavender. You can
still see some of these lavender windows in vintage buildings…. Back Bay homes
in Boston, Walmer Castle in Kent, Sanssouci Palace in Potsdam, Germany. Occasionally I’ve seen a window or two of
the same purple glass in old buildings which haven’t been “restored”. I would love to hear your opinion about this
effect.
We can purposefully add a metal in order to induce a colour, but the raw ingredients may contain metal impurities; a common one is Fe. Contaminants need only be present in tiny amounts to introduce a colour. The green tinge is often associated with Fe and it’s possible to mask this by using a metal offering complimentary colours (e.g. Se – pink; Co – blue). Thus, a better term would be neutralising or counter-dyeing. These will reduce the overall light transmission, but can lead to a greying of the glass.
High purity raw materials will help, and it’s often important to control the oxidation state of the metal (controlling the proportions of O present in the furnace) and the heat-treatment of the melt.
Mn was popular because it has a range of oxidation states and the highest, Mn(VII), absorbs green light but transmits to either side … generating shades of purple; Mn also helps ensure the iron present is in the Fe(III) state (Fe3+), which imparts only a pale yellow to the glass and is therefore easier to neutralise. The action of UV light imparts sufficient energy to alter the oxidation state of the metals present – including Mn – and so initial colours may alter over time. Indeed, the use of artificial UV lighting in so-called ‘purpling boxes’ will accelerate such effects.
Mn ceased to be used in this way from WW1 as the major source at that time was Germany.
I do stained glass and glass mosaics as a hobby. Some glass breaks evenly, and some breaks
irregularly. Please discuss this effect a little further.
From Léonie Seliger, head of the Cathedral’s Glass Studio: “Some glasses are simply harder than others due to their composition. American opalescent glasses for instant are really difficult to cut; the feel under the glass cutter is almost as if you are trying to get through very hard plastic. You don’t hear the nice musical sound a glass cutter’s wheel makes on normal glass (the sound the French call ‘le chant du diamant’), and the cut is almost invisible on American opalescent glass. It’s hard to break, and I find the break runs away from the cut more often than on normal glass. A major suspect for glass breaking irregularly is poor annealing. Glass that retains internal stresses (because they were not given enough time to dissipate as the glass cools down) will jump unexpectedly, sometimes even while you are still running the glass cutter over it. That can give you quite a start, wastes glass, and makes me very uneasy about using glass from a poorly annealed sheet. It’s alright if you cut it into small pieces, but I would steer away from using large pieces from a stressed sheet in a window. They could fracture when experiencing a measure of strain that well-annealed glass would withstand without any problems.”
My perspective: I think there are two principal length scales: atomic and mesoscopic.
On the atomic scale it's the chemical bonding that dominates of course; composition is the key factor here. Some of the hardest, most brittle glasses we ever made were phosphates containing multivalent rare earth metals; that was all down to their atomic-scale structure and the bonding that went with it. Move to silicates in which the 3D [SiO4] tetrahedral network is heavily disrupted by alkali metals and these physical properties alter considerably. At longer length scales, the effects of inhomogeneities come into play: variations in local density and/or composition, which are highly likely to have their origins in processing (- batch mixing, heating profile and annealing). I suppose one might tack on a third scale associated with microscopic/macroscopic factors like inclusions in the glass, including bubbles, and variations in thickness - but that's beyond my understanding.
Does this have possibilities ?

“in which they took balsa wood and removed its lignin – a component of wood that gives it [compressive] strength and colour [cell walls and related tissue; cellulose provides tensile strength]. Acrylic, which is non-biodegradable and water-repellent, was introduced into the remaining tissues where it filled both the tiny pores left by the removal of lignin and the hollow vessels that carried water in the tree. That, said Montanari, not only helped maintain the wood’s structure but also restored its strength and improved its optical properties. The upshot was a frosted-looking wood-based material. In the latest work the acrylic was mixed with another substance called polyethylene glycol, which permeates wood well.” https://www.theguardian.com/environment/2019/apr/03/scientists-invent-transparent-wood-in-search-for-eco-friendly-building-material
How do they make these?
Millefiori Glass Paperweights; it’s a bit like the glass version of ‘Brighton rock’, but perhaps easiest to watch:https://www.youtube.com/watch?v=CYUqvLAeyg4&ab_channel=KSMQPublicTelevision
https://www.youtube.com/watch?v=dQw_yUsTVS0&ab_channel=PanosEgglezos

I was quite surprised
to find how recent plate glass windows are.
Yes, the really smooth, highly transparent and toughened variant arrived during our lifetime. There were large sheets before that, but of relatively poor/non-uniform quality. For details see: ‘Float: Pilkington’s Glass Revolution’ by David J. Bricknell (ISBN 978-1-905472-11-6, 2009.
Fascinated by the idea of neutron diffraction. I'm OK with wave particle duality, de Broglie
wavelength, electron diffraction etc so am fine with the principles, but how do
you separate the neutrons, how can they be accelerated to required energies,
and how are they detected once diffracted?
You’ve done the hard part; coming to terms with the fact that sub-atomic particles can behave like waves and thus be used to perform diffraction experiments is the key step; thereafter it’s fairly conventional.
Neutrons streaming from a nuclear reactor, for instance (e.g. https://www.ill.eu/about-the-ill) emerge with a range of speeds – i.e. energies, or wavelengths – so we can use a suitable crystal as a monochromator via Bragg’s Equation: hey presto we have a monochromatic beam of neutrons heading towards our sample. Of course, we first have to define a ‘beam’, but this can be done using standard shielding material to make a collimator. Post-sample detection as a function of angle is also relatively straightforward since neutrons, though uncharged, will interact with matter; a common form of detector uses scintillation: the neutron is absorbed by an atom’s nucleus – for example, Li, doped into a glass, is highly efficient at absorbing neutrons and when it does so a gamma ray is released which may then be detected relatively straightforwardly.
One can separate the neutrons generated by an accelerator source into their energies, or wavelengths, simply by timing their flight between two fixed points (using small detectors that sample the passing beam). The detectors will not now sort what emerges from the sample as a function of angle but rather on the basis of their time of flight (e.g. where I worked for a few years in the early ‘80s https://www.isis.stfc.ac.uk/Pages/About.aspx - I’ve posted on this a few years ago on my blog: https://bobreflected.blogspot.com/2016/03/large-scale-facilities-for-small-scale.html ).
How long does it take to grow a ‘Venus Flower Basket’ skeleton?
Because euplectella aspergillum is found at such great depths the information about its active life is limited. This is an animal that protrudes from the rocky ocean bottoms, also making it a benthic (bottom dweller) animal. Details of reproduction of E. aspergillum are not known, therefore we can only assume it’s similar to the normal forms of reproduction in related sponges.
How much stronger is glass in compression than in tension?
The compressive strength of glass is extremely high: 1000 N/mm2 = 1000 MPa (for comparison, atmospheric pressure is 101 KPa – i.e. about 10,000 times smaller). This means that to shatter a 1 cm cube of glass, it requires a load of some 10 tonnes. Its resistance to tensile stress is significantly lower: 40 MPa (N/mm2) for annealed glass and 120 to 200 MPa for toughened glass (depending on thickness, edgework, holes, notches etc). (by the way, glass is a perfectly elastic material: it does not exhibit permanent deformation, until breakage. However it is fragile, and will break without warning if subjected to excessive stress.)
Subscribe to:
Posts (Atom)