Thursday 8 October 2020

Third Age Physics


This post serves as the 'contents page' for a series of videos to be uploaded to YouTube during the final months of 2020. In essence, they are the online version of various physics-inspired sessions put together during recent years for the 1000+ members of my local U3A branch. This year, being the fun-fest that it isn't, requires a different approach - one that doesn't depend upon face-to-face indoor events. Assiduous readers of my blog - if there are any - will realise that this is the third series of videos to be made available this year, and the second to be dedicated to the non-expert but highly intelligent U3A participants I have come to love spending time with. (Details of the first 'U3A series' may be found in an earlier post, here. There is also a series curated from the surviving recordings of my pre-retirement lectures for Foundation Year Physics students; the details are here.) Apart from providing the YouTube address of each video, I'll use the post as a convenient repository for the details of any 'further reading' (or viewing) suggestions that come to mind. What I'll not be able to offer here is access to the online discussion/Q&A sessions planned as a follow-up to the initial video; sorry, but those must remain within the purview of my local U3A coordinators.

Each video will have been recorded in a single take, and without a script or notes in order to try to reproduce the 'live' experience. Also, it would simply be too dispiriting to deliver a long and stilted monologue by reading from a script ... oh how I miss sharing my love of science face-to-face with a group of people who can provide real-time feedback!  This video-based approach is, you can tell, not my ideal - although a variant of it worked very well when I was teaching students (see here) as face-to-face follow-up sessions were built into the process.  The upshot is that viewers will get all my stumbles, throat-clearing, failures in memory and moments of lost track: forbearance is a good quality in such contexts. I am not, as you will rapidly discern, a 'natural' in front of the camera. (I'm reminded of the media training day I attended a few years prior to retiring during which I was recorded being interviewed: the feedback was hilarious. Apparently, one of my sentences lasted 35 seconds! You have been warned.)

Only after beginning the project did it fully dawn on me what a significant undertaking it was. It's far more tiring to record a talk than it is to share it face-to-face with people. Furthermore, I have allowed myself the opportunity to include more material than I might have risked in a live performance. I have tried not to lose all sense of restraint in this regard but it's been good to have the opportunity of sharing a few more artefacts for instance. What I will try to ensure is that I build a 'sanity break' into the videos every 40 minutes or so: a juncture at which it's easily possible to have a rest. I may do this within a given video or by splitting the thing into two or more parts.

One more thing: although it's entirely possible to read my blog and watch the videos on any suitable device, the larger the screen the more you'll see. It was ever digitally thus 😉


1. What's so special about the Earth?
87 minutes, with an intermission at 42 minutes; there is seven minutes-worth of optional additional material tacked onto the end.
The original U3A programme abstract read: "With the discovery of planets orbiting stars other than our own Sun, several of which have been labelled ‘Earth-like’, it might be tempting to conclude that we’re really not that special. Moreover, some might argue that humankind ought to consider spreading out and colonising such exoplanets. Is any of this reasonable?" This topic is tackled first as there is only one practical demonstration I wished to show. This was, in a way, selected as the test-bed for subsequent videos in the present series.

There are a couple of my former blog posts which include relevant information and additional links: on star and planetary formation and on the very subject of the U3A talk at the heart of this topic, here. Indeed, many of the links shown below are also included in these earlier posts.

Useful video/animation links cited within the talk include:
On the scale of bodies in the Solar System
On solar wind 
On tectonic plate movement and similarly here
On the Earth-Moon rotation about their barycentre  
A fun look at the earth’s rotation on its axis.
Also, there's a great TV documentary available on the importance of the Moon. Whilst on the subject, this is a link to a brief computer simulated animation depicting the probable violent birth of our moon after the Earth collided with a Mars-sized planet in the early years of the Solar System; it shows clearly why the chemical/mineral composition of the Moon is almost identical to the Earth: they both solidified from the same 'mixing pot'. Indeed, since making the video I have come across another contribution to life on Earth made by the Moon: apparently, it once had a weak magnetic field which provided important additional shielding for emerging life on our planet - see here for details.
(Diagrams and figures used in the slides have references to their sources included on the page itself.) 

p.s. I am indebted to Leigh Edwards for pointing out in a comment on YouTube that there are ~100-200 billion stars in the Milky Way - I used the word "million" in error; my apologies.


2. Radiation: bad, benign, beneficial - Parts 1 ,2 & 3
Part 2: bad and 'benign' - balancing risk (62 minutes, with an intermission at 27 minutes)

The original U3A programme abstract read: "Radiation, has been of considerable interest for over a century – but how much do we know about it? Together, we’ll take a look at its origins and effects – bad, benign and beneficial – from a scientific perspective."

There is a blog post written previously which include relevant information and additional links, here
UK figures on radiation exposure. Other links are shown within the slides in the video.


3. Glass: a look inside - science, technology and art
Part 1: what is a glass and what goes into the mix? Glass in nature, both hot and cold. (58 minutes, with a break at 32 minutes)
Part 2: glass-making technology; looking deeper inside. (45 minutes)
Part 3staining and painting, sculpture and culture. (41 minutes)
Part 4technology and engineering - glass in the development of science, communications, consumer items, architecture and the kitchen. (55 minutes, with a break at 33 minutes)
Part 5: towards the cutting edge - bioactive glassy materials and some major breakthroughs in physics; myths, breakages and sound. (67 minutes, with a break at 37 minutes)

The original U3A programme abstract read: ‘Glass has existed in nature for billions of years; mankind has been using it since the Stone Age. It is ubiquitous, often irreplaceable, in art, in technology & engineering, & in science. We'll discover, at the level of its constituent atoms, what a glass is; we'll look at its uses in technology, in art, architecture, & in science: from bottles to stained glass windows, to scaffolds for re-generating bones & for drug delivery.’ This online version covers material from what was originally a little less than four hours of 'live' event spread across three sessions, hence the necessity for multiple videos. Having indulged myself by including an extended range of 'show-and-tell' artefacts, the five constituent videos in this series will, if you watch them all, take approximately four and a half hours. By the way, I hope you like the green-screen backdrops to this series: if nothing else, it will make a change from the bookcases against my study wall.

There are several of my former blog posts which include relevant information and additional links, but here I include only three of them: here, here and here. There is also a one-hour video, recorded some years ago in Canterbury’s Heritage Museum – now closed, sadly – which covers some of the same ground within a single one-hour video: here

Additionally, you might like to augment this series with the following material:
On 'Prince Rupert's drops' - thermally toughened glass; there are some great ultra-slow motion sequences. YouTube provides a treasure-trove of accessible material on glass-blowing, float glass processing, making stained glass panels and all sorts of other relevant topics.
Some of the general interest books on glass from my shelves, should you want or need additional reading material:


4. Colour 
Part 1: introduction, Newton's approach (the electromagnetic spectrum, prisms, rainbows etc.) - 35 minutes.
Part 2: a look at Goethe's observations and Turner's use of his idea (perception and interpretation) - 34 minutes.

There are a lot of demonstration-type experiments in the face-to-face original session, so it's impracticable even to attempt to translate this into video format given my limited home setup. However, by stripping out the more challenging demonstrations, a variant of the material becomes a (hopefully serviceable) possibility.
The original U3A programme abstract read: ‘Most of us grew up on Isaac Newton’s theory of colour; we use it to explain a multitude of everyday things like rainbows. There were alternative theories however, like those derived from the careful observations of Johann Wolfgang von Goethe – who influenced JMW Turner’s choice of colours very significantly. We’ll explore the world of colour from a scientific perspective, and in the process consider the role of individual perception in our technicolour world.’
There are a couple of my earlier blog posts which include relevant information and additional links: here and here including a link to one of the projects I undertook with the Turner Contemporary gallery in Margate (here). 
Also, there's a fascinating video series available on Goethe’s approach to colour.
If you want to dig a little deeper into the phenomenon of the refraction of light, then video 30 in the 'Physics Beyond the House' series will provide further details; other videos in the series offer additional information on the electromagnetic spectrum etc.


Wednesday 9 September 2020

“So, what is it?” – astronomy that is


Although I watched some of the early series, I confess that the BBC’s ‘Red Dwarf’ never became one of my favourite TV shows. Perhaps it was the science nerd in me, although that hasn’t dampened my enjoyment of other SciFi programmes or movies. However, a handful of snippets seem to have lodged in my mind, one of which lies within the ‘White Hole’ episode (see here) in which the concept of a white hole is discussed. Their interpretation of the physics associated with mathematical models of white holes, which began to emerge during the 1970s and onwards, was almost nonsensical – but the repeated question “So, what is it?” reflects an important aspect of the life scientific. For reasons which will hopefully become apparent as you read on, it’s a memory that resurfaced recently as I reflected on a Q&A session I was involved in on the subject of astronomy.

There were no obvious images to go with this post, so I’ll treat you to my latest attempts at astrophotography from my garden: Mars and Venus ... The other shot of Venus was taken in May, when far less of its illuminated surface was visible from Earth - that's why it's so very bright at present. For a little more detail on my stumbling attempts at astrophotography see my previous blog post, here. (Just for fun, note the south polar ice cap just about discernible on Mars.)

Well, what do you think astronomy is? The commendably brief definition provided by the online Collins English Dictionary states that it is “the scientific study of the stars, planets, and other natural objects in space” or alternatively “the scientific study of the individual celestial bodies (excluding the earth) and of the universe as a whole”. As a former academic who worked cheek-by-jowl for several decades with professional astronomers, and as an amateur stargazer myself (see my previous blog post, here) I’d have to say that either form of words covers the subject tolerably well. I could take issue with the dictionary at the fringes of its definition, but that might end up multiplying the number of words without generating a significant improvement to one’s actual understanding. One of the things I’ve repeatedly discovered over the years in speaking to non-experts about science is that the connotations they have for words with which I feel ‘at home’ may be quite different to my own. Avoiding the pitfalls that can arise from a failure to get to grips with the background and expectations of participants is a key ingredient to successful science communication and engagement. I recently had another opportunity to observe the existence of this apparent dissonance … 

Earlier this year – indeed, well before lockdown/shielding – I hatched a plan, in cahoots with the science coordinator of the local branch of the U3A (Alan Chadwick, search here for subject coordinators, science) to organise and co-host an open ‘Q&A’ session as part of the 2020 summer programme of events. Topics in science account for only about 10-15% of what is on offer to members, so I’m continually on the lookout for ways in which one might extend and broaden the appeal. I contacted my fellow science theme leaders – a handful of similarly committed people – and made sure that enough of them were interested to make it viable. As with so many of our ideas, good or not-so-good, the rise of the COVID19 troubles forced a rethink. We opted for a series of monthly video-streaming sessions, each having a specific theme and with questions sent in advance to the two people designated as leaders. Second in the series, after ‘Diet’ was a session on ‘Astronomy’, for which I was one of the volunteer leaders. It’s not my intention to summarise the 90-minute session, although I can say that it was as much fun as it was exhausting, but there are a couple of thoughts that occurred to me during the run-up to it and as it unfolded. The first and obvious point is that the submitted questions, augmented during the session through the online ‘chat’ facility offered by our chosen platform, covered a lot of ground. More than that however, one might interpret the questions as providing a snapshot of what our participants thought astronomy was actually all about. Thus, alongside the choice of observing targets and what instruments might be useful, and several cosmology questions centred on the Big Bang, black holes and the various multiverse theories, we had questions on colonising Mars (and further afield), space junk and extra-terrestrials. One lovely question alluded to ‘spiders on mars’ – see here for the non-Bowie answer ;-) 

It might have been tempting to filter or to re-interpret the submitted questions, but that would have been a mistake in my opinion. All the topics raised were, in the minds of our sharp-witted questioners, ‘astronomy’; as such, each and every one of them deserved to be taken seriously and given as sensible and as full an answer as we could. When I was still an academic, and doing my best not only to teach a physics syllabus but also to inspire in a broader sense, there were a couple of phrases I used early on when talking with each year’s new intake: “there’s no such thing as a silly question” and “science is always wrong”. Both require humility on the part of the lecturer/course leader. The first speaks to the desirability of starting from where the questioner is, and not imposing pre-conditions. The second opens up a discussion on the scientific method and how it progressively reveals the nature of our world/universe to us, with each generation of theories yielding to the better ones that follow. Both aspects came to the fore more than once during our Q&A, even if only tangentially.

Our next monthly online science forum is on ‘ecology’, and the one after that is on ‘chemistry’. I’m chairing the latter so I can only hope that I make the two-person ‘panel’ and their questioners feel as valued and comfortable as I was made to feel. So, a blockage to our original plan for a one-off Q&A has been turned into an opportunity for a whole series of online sessions … science communication in action, aided and abetted by the ever-present forces of serendipity.


Wednesday 12 August 2020

Pictures of a stargazer


It’s a good job I write primarily for myself, for the sheer pleasure of playing with words as a way to uncover my thoughts. It’s a good job because it allows me cheerfully to draft this post even though I’m sure that, for some of its readers, there’ll be a sharp intake of breath as they discern my ignorance and naïvety. I’m going to share with you my reflections on the stumbling restart in retirement of two of my childhood hobbies: astronomy and photography. In truth, neither of those terms are being used properly. I’ve seen the work of amateurs who take amazing photographs and I don’t compare – I was always more interested in aspects of technique, and, back in the day this included processing of ‘black and white’ photographs in various borrowed darkrooms. Even now, you’ll see me playing with the options on my smartphone rather than worrying about composition. Likewise, I’ve worked alongside and been in awe of talented professional astronomers (see here) and I marvel at the knowledge of dedicated amateurs (e.g. here). Thus, whilst I certainly learnt my way around the constellations and the details of the solar system as a child, it’s still more accurate to describe me using the diminutive: ‘stargazer’. Indeed, despite having treated myself to a retirement present of a lovely telescope, I remain happy simply to gaze: to gaze either at the whole sky – or what fraction of its delights that light pollution leaves to us – or, nowadays, to let my telescope meander across the heavens. Every patch of the night sky I turn my attention to, it seems to me, contains examples of unutterable and mysterious beauty. However, I have latterly begun to play with astrophotography; these are my reflections on the early stages of my rediscovery of the night sky. My recommendation is that you try to read it on a screen larger than a smartphone as there are a lot of images that will benefit from the expanded scale. Make yourself a drink and find somewhere comfortable to sit as this is going to be a long post!

Day one: assemble the delivered tripod and equatorial mount, with its geared motors; put the telescope together, checking the alignment of its mirror, fitting and aligning the small ‘finder-scope’ used to navigate to the right bit of sky, and fitting an eyepiece. Everything then needs to be balanced so that the small drive motors are not placed under strain; I’ve taken to using insulating tape in order to mark balance points etc. as it reduces the time taken to get everything set up for an evening’s observation in the garden. You can find all sorts of excellent descriptions of how the various sorts of telescopes work, so I’ll not bore with details beyond the fact that mine is a 150 mm Newtonian reflector on a motor-driven equatorial mount. It has a relatively long body, which helps with contrast when viewing planets. The key point about the equatorial mount is that it’s set to the observer’s latitude (51.28º N in my case); thus, once properly set up and pointing at the object being observed, it requires only one motorized drive in order to keep that object in the field of view as the Earth rotates underneath. The important phrase is ‘once properly set up’ – therein lies many a challenge. (All my kit was purchased locally, from F1 Telescopes. Sadly, after 20 years supporting amateur astronomers in Kent, they have recently ceased trading.)

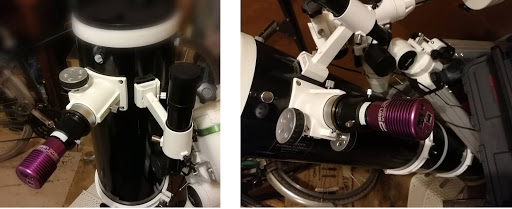
After an initial attempt to capture images through the telescope’s eyepiece using a clamp to hold my smartphone in place, I gave up. It was an inexpensive method, but very frustrating in practice and I failed to get anything I was genuinely pleased with. I therefore opted for a bespoke imaging device which is in essence a digital camera or, rather, it’s the electronic heart of a camera: the light-sensitive chip that captures the image. The camera’s optical components, i.e. the complex lens assembly, is replaced by my telescope and all the software to control exposures, store the resultant images etc. resides in software on my laptop. My camera is the purple device shown above (Altair Astro GPCAM-290c). It directly replaces the eyepiece, and connects to my laptop via a USB cable.

My initial ambition was to be able to view objects within the solar system – all eight planets if I could, although I was only confident about observing the Moon, Venus, Mars, Jupiter and Saturn. These are easily visible to the naked eye as bright spots in the sky – a large disk in the case of the Moon – although it’s far harder to make out colour and detail, even using binoculars. The choice of telescope was made with that overall goal to the fore. Beyond that I thought I might enjoy a few star clusters, like the Pleiades and perhaps a binary star here and there. It is probably true of all hobbies, but the evolution in my objectives was rapid. I started hunting out galaxies, such as our neighbour Andromeda, and nebulae (vast clouds of gas and dust, from which stars are created) like the Orion Nebula which, you’ll not be surprised to hear, sits within the constellation of Orion.

Here it all is, set up in my back garden, camera connected to my laptop. The tripod has been aligned to North and levelled, the telescope is balanced and we’re ready to go.

Although one can pick out lots of detail on solar system objects through the telescope eyepiece, one is immediately and repeatedly reminded that the human eye isn’t good at seeing colour when the light intensity is low. That issue is made even more obvious when observing deep sky objects like galaxies and nebulae: they might easily be written off as wisps of cloud to the uninitiated. (Deep sky refers to objects that lie outside the solar system and are not individual stars, e.g. other galaxies, star clusters or nebulae.) So, having purchased the telescope from the gifts given to me by my family for Christmas/birthday, my wish-list for the following year contained a plea for contributions towards a decent first astro-camera. It’s barely left the telescope since. Everything has a cost of course, beyond the monetary, and in this case it’s the need to master a lot of new software in order even to capture an image in the first place let alone process the resultant data into something vaguely pleasing. The learning curve is steep and long, and the further I travel along it the more I realise I need to learn. Thankfully, there are many others out there travelling the same road – and some are sufficiently far ahead that it’s possible to learn from them. On Twitter, for instance, I’ve latched on to several people’s posts as a source both of inspiration and education (e.g. this tweep and this one) and have found some genuinely useful material on YouTube (e.g. here). Also, to be frank with you, I’d be further along the road were it not for the fact that the COVID-19 lockdown – shielding in my case – had the bizarre effect of sapping the fun out of pre-existing hobbies. As a result, I all-but ignored my telescope, and creative writing, and reading, and … for several months. I replacing them with the creation of a couple of video series: Physics in the House aimed at the membership of my local U3A branch (here) and Physics Beyond the House. Although I’m still not writing much – snippets, and a couple of free-form poems in order to have something to discuss over Zoom with the Creative Writing group I’m in – I have started reading again, and most importantly I’ve had the telescope out in the garden once more.

Rather than expose too much of my inexperience in this post, I’ll show you a few of the images I have captured. I’ll use the associated captions in order to fill in a few of the details.

These images of the Moon illustrate one of the issues. The image on the left is a picture captured using my smartphone at the eyepiece: I get the entire Moon, but the detail is poor; I could have persisted using the ‘Raw’ and ‘Pro’ options on the ’phone camera in order to control the setting manually, but the incentive was weak given the difficulty of aligning the thing in the first place. Having moved to the bespoke astro-camera and it’s possible to get the central image. In terms of quality, this is so much better – but the field-of-view (FoV) is severely limited. Now, the Moon has an apparent diameter which extends across 31 arcmin – i.e. about ½º – so that implies my telescope/camera combination will image only about ¼ - ⅓ of that, or about 8-10 arcmin. (There are 60 arc minutes in one degree, 60 arc seconds per arcmin.) Thus, to get the image on the right I had to combine five separate overlapping images into one mosaic composite. The detail is far better resolved; indeed, by comparing the image to a lunar map (- there’s an excellent app called LunarMap HD which will suffice for most purposes) I estimate that features down to about 30-40 km are identifiable. Although it took a lot of time and effort I think my composite image is rather nice, even though I say so myself ;-)

The Moon video above, which is best viewed in full screen mode, illustrates two important points: the way in which images are captured and the effects of atmospheric turbulence. Playing the video in slow motion and/or on a larger screen will help reveal the apparent ripples on the Moon.) ‘Seeing’ is the astronomer’s term for the effect of turbulence caused by thermal effects in the atmosphere which cause variations in its refractive index and therefore distortions in what is observed at ground level. (See video (17) in my Physics in the House series for an explanation of the phenomenon of refraction.) However, it also allows me to introduce a key feature in the image-capturing process. One doesn’t, as a rule, simply ‘click’ and take a single frame; instead, an extended series of frames (referred to in the jargon as sub-exposures, or ‘subs’) is captured in the form of a movie file. The details of each frame are set in advance – so, for instance, the exposure time might vary from a fraction of a second to several minutes – as is the total number of subs, which is a number typically (for me) in the hundreds. Ideally, the telescope would be set up so precisely that longish exposure times would be practicable and an accumulated total of hours of subs collected. I’m not yet in that league; at the moment I tend to use subs of no more than a second or two at the very best, and I seldom manage more than 500 of them at a time.

These images of Venus (108 million km from the Sun, c.f. the Earth at 150 million km) bring us to the next point. Given that multiple sub-exposures, subs, are collected as a movie, there has to be a process whereby they can be added together: this is called stacking in the trade. There are all sorts of software packages available to help one manage this. I started with Registax but subsequently moved across to AutoStakkert, although I still use Registax for a final 'polish' using its wavelets analysis function. In essence, both of these free-to-download packages allow the user to combine the best of the subs into a final stacked image - I simply find AutoStakkert easier to use. It sounds ‘easy’ but in this stage, as with all the other stages, there are many possible routes one might follow. The version on the left was stacked via one ostensibly reasonable route whereas the image on the right, which is significantly ‘sharper’ is the result of taking an alternative route … Whilst there are useful blog posts and YouTube videos, it seems that trial-and-error is the expected way forward. (To be genuinely useful, a tutorial needs to come from someone with experience and understanding and an appreciation of the subtleties of a teacher; this is a combination of skills and attributes hard to find in the plethora of material available online.) In passing, it’s worth noting that Venus appears featureless because it’s completely covered in relatively reflective clouds - I'd need sensitivity to uv light in order to be able to pick out variations. Also, because it’s closer to the Sun than is the Earth, we get to see it as a crescent – for exactly the same basic reason as we enjoy the waxing and waning phases of the Moon. The images shown are in greyscale, but when attempting colour images one needs to be aware that digital cameras are most sensitive to green (see the very first test image I took, below, of a distant TV aerial). Further image processing is a necessity in order to bring out the colours; I use an old version of Adobe Photoshop (CS) for this. To be honest, this is yet another stage in the astrophotography game that I continue to struggle with: there are endless combinations of ‘levels’, ‘curves’, ‘colour balance’, ‘saturation’ and ‘brightness/contrast’ to play around with. Experience is everything, and that takes time to accrue.


The above images of Jupiter (780 million km from the Sun), and particularly of Saturn (1.4 billion km from the Sun) show how important it is to have good ‘seeing’. Both stacked images came from ~500 sub-exposures (subs), with ~25% of the best of them contributing to the stacked images seen here. The picture of Jupiter looks OK – indeed, we can see three of its moons (see re-processed images below, in which the brightness around the planet has been boosted; the inverted image on the right provides another route by which fainter objects might be spotted). The stacked image of Saturn is less good however: we can’t resolve even the separation of the two major ring systems, which I’ve observed through the eyepiece before, and none of its moons are visible. The images were collected on the same night’s observation earlier this month and provide a perfect example of the losses one incurs when the seeing is not optimal.


Now we come onto Deep Sky images, although still within our own galaxy, the Milky Way. Shown above is M32, the Orion Nebula, which is a vast cloud of dust and gas – the material from which new stars are formed. The cloud is illuminated and energised by some very bright stars – the four near the centre of this image – which are emitting a lot of UV light and causing the gas to glow. It’s a little over 1,344 light years away (i.e. the light which formed this image began its journey across space in the year in which, according to Wikipedia, “King Wulfhere of Mercia dies after a 17-year reign and is succeeded by his brother Æthelred; King Hlothhere of Kent re-establishes Kentish supremacy in London; in Japan, Emperor Tenmu decrees the end of serfdom and issues a decree to distribute the tax-rice for peasants in poverty”. This is the first, and so far only such object captured – a fact that is all too evident in the rudimentary nature of the image. I’ll return to this at some stage and re-observe it in light of my growing experience. If nothing else, I’ll need more and longer subs which in turn means a superbly set up telescope. In addition, given that M42 covers a relatively large patch of the sky, 1½ x 1º, and noting the very small field-of-view accessible from my equipment, you’ll appreciate that I’m only able to capture a small proportion of the whole nebula. (The location map on the right is taken from here.)

This is as good a point as any to talk about the tricky business of focusing - tricky because each touch on the telescope's focus wheel sets up vibrations in the image. One effective solution is the use of something called a Bahtinov mask (see here for details) which covers the telescope's objective and creates a diffraction pattern in the eyepiece/camera. The physics behind diffraction patterns need not detain us here, fascinating though it is, since the key point is easy to describe. With the telescope's field of view centred on a reasonably bright star, one adjusts the focus until the arms of the X-shaped lines cross at the star's centre. At that point, the system is focused and the mask may be removed. All one needs is enough starlight to generate a visible pattern: the one in the image above is too bright.

The image above is, I think, of the binary star system ‘Epsilon (ε) Dra (Σ2603)’ in Draco, near the Plough. However, I only think it is … a fact that brings us to yet another problem which needs some sort of solution. I need an accurate idea of where I am looking. There are computer algorithms, called ‘plate resolving software’, which can analyse the stars in an image and provide a precise location – but they won’t operate with the equipment I have because of the limited field-of-view I’ve mentioned before, i.e. there are not enough things in view for the algorithm to work. The same issue pertains to locating individual objects like galaxies or the smaller and more distance nebulae, which is why ‘easy’ targets like the Orion Nebula are the only realistic ones for me at present.


I can’t conclude without mentioning our nearest star, the Sun. Apart from anything else, this is astronomy that can be undertaken without the loss of sleep! For a small outlay, I bought an A4 sheet of specialist solar filter material that blocks 99.999% of the Sun’s light. I glued and duct-taped the major portion onto the ring of a cake mould which was large enough to slip over the front of my telescope, and used most of the rest to make a similar cover for the telescope’s finder scope out of a length of plastic tubing. The mottled appearance to the Sun’s surface is from the huge convection currents that churn through its surface layers. Notice the limits imposed by the small available FoV again. There were no sunspots on the day I tried this out, but one day …

I could easily spend the next season getting improved versions of the above images. Whilst better seeing is down to the atmosphere, I could introduce a more sophisticated setup procedure for the telescope (Polar Alignment is an obvious next step: referencing the initial alignment to Polaris, the Pole Star, about which the night sky rotates) and then collect more/longer subs so as to get an improved final image. However, I want to combine that with an expansion in the list of targets. I still want to work my way through the solar system of course, but there are some Deep Sky objects I’d also like to track down which will survive the limited FoV of my current telescope and camera. After that I shall need to bring out my little contributions ‘money box’ again.


This post is dedicated to Rachel, who wanted to know more – it’s always good to want to know.


Saturday 4 July 2020

Physics in the House and Beyond: in praise of serendipity


The word ‘serendipity’ appears in more than one in five of my posts. I checked. It swims just beneath the surface in many more – arguably in the majority. My Oxford English Dictionary defines it as “the faculty of making happy and unexpected discoveries by accident”. Happy accidents; happy surprises. Just so. Given that the principal theme to this blog relates to my personal reflections as a scientist on topics and events that have entered my life, it would be fair to conclude that serendipity has played a major role within my career, and beyond. However, despite that glowing background, it might seem a little odd to write about making happy and unexpected discoveries in this the year of COVID19. Far from it. There have been some very positive outfalls from the necessary restrictions to all our lives: from the sound of birdsong and rustling leaves free of traffic noise (and fumes!) to the presence of skies unspoiled by aircraft contrails, and all the way up to clapping newly recognised heroes from our doorsteps and the rediscovery of the importance of each other. Whilst I could wax lyrical about such things, it’s perhaps best to stay within the blog’s overarching theme lest I be carried away, or off …


In a tweet posted earlier today (3rd July; screenshot above) Daniel Harding highlighted serendipity’s role in the developments of my life. In fairness, I opened myself up for the comment because, a few days ago, I had revealed as much in a conversation he’d recorded as the opening salvo in his new podcast. (‘Zoom for Thought’, which you’ll be able to find and listen to here; it’s also on Spotify if you prefer. The episode in question is the very first one.) Apart from being a thoroughly nice person with whom to spend a little time in conversation, Dan is also someone I admire for his abilities in music. Indeed, there are CDs that owe their place on my shelves to his enlightening comments and suggestions, begun when I was still a physics lecturer at the University of Kent and he the university’s Deputy Director of Music. We bump into each other still on occasion – or did prior to March of this year – but have mostly kept in touch via posts and messages on Twitter. It would be hard to identify precisely the thread which led to our recorded conversation and the resulting podcast – but it certainly qualifies as serendipitous. Listen for yourselves here, or click on the embedded copy below; it’s sixteen minutes long and includes a wonderful few seconds in which I manage to tie my tongue in quite a knot.


As you listen you’ll hear mention of the U3A (University of the Third Age, specifically the Canterbury group) and it’s my involvement with the U3A that really kicked off the idea that Dan floated concerning his new podcast. It boiled down to his suggestion that we have a chat about the creative ways in which he and I were trying to continue to teach, play music, share passions and perform during the various stages of COVID19 ‘lockdown’. Why me?* Well, because he knew that I had sought a way to continue offering scientific insights in spite of the lockdown and that the effort had given rise to my ‘Physics in the House’ video series – the details of which are in an earlier blog post, here. My idea, such as it was, centred on using objects or devices one might be familiar with in the house to illustrate a particular topic in physics. I hoped that by doing this, and by keeping the mathematics to an absolute minimum, I might encourage a few people to realise how central is the subject to their daily lives. Beyond the fact that it was fun for me to do, I had no idea whether anyone else would actually derive any benefit from it at all – let alone my intended audience. I must therefore include as integral to the happy accidents associated with the ‘Physics in the House’ project the fact that it was picked up by the U3A nationally and has been used to spark science-based conversations hundreds of miles from my home base. Moreover, the feedback overall has been a very special part of the happiness with which I now associate the series, including from someone who watched the videos from his hospital bed. (Sadly, a promised call from a local radio station to talk about the series never materialised. It would have been nice to have been able to share the project with a broader audience, but it was not to be.)

In Dan’s case. One might point to his creation of an internet-mediated performance of the first movement of Vivaldi’s Gloria (details here, and on YouTube here). As it happens, a friend of mine was singing in this, so I first heard it at his prompting. Another joyful performance by Dan with another pianist arises from his love of jazz: the two-piano Doxy by Sonny Rollins, here. Thus, despite our ostensibly very different fields of endeavour, the physical sciences and music, Dan and I found that we shared a great deal of recent creative experience. Furthermore, it became clear that for both of us not to try to find a way through the limitations and barriers was simply inconceivable – a fact that emerges clearly, I think, from the podcast.

As the ‘Physics in the House’ project came to its natural end, it occurred to me that I could augment the series by sharing the video recordings of the foundation-level lectures I delivered when still a salaried lecturer. (I have written before about my experiments with lecture recordings, see here) Before I retired, and knowing that all my recordings would be deleted by my university as a matter of course, I made copies of one year’s worth as an archive. With their permission I have now re-purposed that material as a series of more challenging videos which I’ve labelled ‘Physics Beyond the House’. This was all taking place as the initial ‘lockdown’ rules were beginning to be relaxed, so it seemed somehow ‘to fit’. The details are available in the post immediately preceding this one, here.

And it hasn’t stopped. With a friend and former colleague – and local U3A Science Coordinator – Alan Chadwick, I’m helping to set up a science-based open Q&A session via video link. More of that later …

All-in-all, there’s lots to celebrate when it comes to making happy and unexpected discoveries by accident, even in trying times.


* I did ask this question, more than once.


Tuesday 16 June 2020

Physics Beyond the House


This is a follow-on from my previous post 'Physics in the House', which may be found here. In that post I collated links to a series of relatively brief videos made during the core period of the UK's 'COVID-19 lockdown' and provided a few background notes as well as links to additional material. Here I'm offering another collection of videos on foundational topics in Physics; their content will. however, be a little more challenging ...

It occurred to me whilst filming for 'Physics in the House' that I might re-purpose the video podcasts I created of the 'Foundation Year' lectures* I delivered during the academic year beginning September 2012. I had downloaded these podcasts prior to my retirement as an academic from the University of Kent's School of Physical Sciences simply because I wanted an archive of the material I'd invested a lot in generating (see my blog post here for some insight) and I knew that it would all be deleted automatically. It was vanity of course, as so much is. The material is of no use to my old department now but, although the syllabus, style of delivery and lecturer may change, the fundamentals of Physics do not; I have their permission to make them available to a new set of students. The content is at a level which, roughly speaking, corresponds to the final two years of school education in the UK (so-called 'A'-level). I still have in mind as my target audience the ever-learning members of my local University of the Third Age group, which has a membership numbering well over 1000 - many of whom love learning about topics in science despite being non-scientists (whatever that might mean).

Few projects are straightforward, and this one is no exception. My original plan was to upload the lectures in their original form: raw, unabridged. Unfortunately, I found several podcast video files were corrupted in some way. Thus, the overall continuity of the lectures would have been wrecked from the outset. What I have done in order to mitigate this problem is to extract whatever topics exist in a reasonably 'complete' form within the surviving recorded lectures using a process of 'cut & paste' in the basic video editing package on my PC. Given the imposed necessity of going through my archive more carefully than originally planned I have taken the opportunity of chopping out a lot of 'extraneous' material. For instance, a very significant fraction of the two major lecture courses that I've plundered for these new single-topic videos were given over to working through relevant numerical problems and to discussing the various student-defined issues worthy of in-class discussion. (These discussions, by the way, could take us way off the syllabus - which was no bad thing in my opinion. Very early on in my relationship with each year's new batch of students I'd make it pretty obvious that I was open to being sidetracked: the result, most years, was a rich seem of enthusiasm-building gold! We always got the core material covered; it always seemed to work out.) I have removed all this material. Thus, the sum total of video time remaining is reduced even further. Having said all that, the resultant series is arguably stronger than it would have been had I simply made available the four dozen or so 50-minute lectures I originally intended to share. Each of these topic-centred videos has a running time in the range 12 to 42 minutes, although most fall within the shorter half of that range. The definitive judgement rests with the viewer of course.

Naturally, much of the 'raw' character is retained. You'll see the younger me in good health and poor, occasionally stumbling, wearing thick sweaters during the prolonged period when the lecture theatre heating failed, needing to shout over the sound of hammer drilling, strolling around and waving my hands about, ...  More annoyingly, you'll also see plenty of evidence for the fact that I was still learning about video-recording of lectures, despite having been one of the very first people to adopt the technology at my university: the volume will be excessively soft in some places and I'll wander out of shot now and again whilst be way too close when I happened to cough or need to blow my nose. You get the picture.

Although there was an extensive 'reading list' associated with the original lectures, my two top recommendations both came from the same author: Jim Breithaupt. I'm absolutely certain that there are now more up-to-date editions, but the above are what I used as the primary backup material for the courses. My drawing skills are notoriously poor, so I am particularly grateful for the fact that so much excellent graphical material exists already. The other resources I drew on for the occasional illustration and for ideas for numerical examples include the house magazines of the Institute of Physics and the Royal Society of Chemistry, the science pages of the BBC News web site and whatever other school-level material I could lay my hands on; I think the latter is covered by the image shown below.  In addition, you'll see a small number of animations within the video series; the web sites on which they may be found are of course displayed on the captured PC display, some  of these may not exist anymore - that is the nature of internet material - but a search using the relevant subject matter as keywords will inevitably turn up a satisfactory alternative.


I plan to get all the videos created and then to upload them at a rate of one every day or two: I'll keep this post updated as things progress.

There are two principal strands: 'Matter' and 'Waves & Vibrations'. The outline of their (surviving content is shown below, including links to the relevant video. In total, these 36 videos represent almost 13½ hours of lecture material - a tiny fraction of my overall teaching commitment within a typical academic year. I have also included an extract from a short series of lectures given on the topic of laboratory work, which covered what's needed in a formal report (and why) together with an overview of elementary error analysis and why that is so very important. I include in this series only the section on errors/uncertainties since COVID-19 has underlined once again the importance of understanding something of uncertainties in experimental data.


1.   Uncertainties associated with experimental data and results.
Topics in the Physics of Matter:
2.   The Atom: Early beginnings, basic descriptions; the nuclear atom, atomic mass and number.
3.   Avogadro’s number, the mole.
4.   More on the Atom: electrons, isotopes, ions.
5.   Types of matter: solids, liquids and gases etc., phase changes.
6.   Chemical bonding: covalent, ionic, metallic, van der Waal, hydrogen.
7.   Inter-atomic forces and potential energy.
8.   Electron excitation
9.   Electron energy levels, emission and absorption spectra.
10. The Bohr model of the atom: energy levels in hydrogen explained.
11. Atomic-scale structure of crystals, polymers and plastics, amorphous materials.
12. X-ray diffraction 
13. Fluids: pressure, Archimedes’ principle, hydrostatics.
14. Heat and temperature scales.
15. Thermometers: gas, resistance, expansion, thermoelectric, optical; notes on absolute temperature, cosmic radiation background.
16. Thermal conduction 
17. Perfect gas laws 
18. Kinetic theory of gases
19. Radioactivity: half-life, decay chains, radioactivity in nature. 
Topics in the Physics of Waves & Vibrations:
20. Definitions and Terminology: oscillations, waves carry energy, progressive wave.
21. Wave properties-i: wavelets, reflection, refraction.
22. Wave properties-ii: dispersion, diffraction, superposition, interference + earthquakes
23. Wave properties-iii: standing/stationary waves
24. Sound-i: introduction - what are sound waves? 
25. Sound-ii: loudness, noise, note, pitch; intensity, intensity level/decibel; ultra-/infra-sound. 
26. Sound-iii: reflection, refraction, interference; beats.
27. Sound-iv: vibrating wire (standing waves), standing waves in tubes; Doppler effect.
28. Electromagnetic spectrum-i: Introduction.
29. Electromagnetic spectrum-ii: Generation and detection of EM waves; making an fm aerial.
30. Electromagnetic spectrum-iii: refraction of light, critical angle, optical fibres; polarisation.  
31. Electromagnetic spectrum-iv: diffraction; interference, Young's double slit experiment. 
32. Electromagnetic spectrum-v: transmission diffraction grating; Michelson interferometer.  
33. Simple Harmonic Motion-i: circular motion, link to simple harmonic motion.  
34. Simple Harmonic Motion-ii: link between SHM and circular motion, displacement, velocity and acceleration; force acting on a body undergoing SHM, mass on a spring. 
35. Simple Harmonic Motion-iii: pendulum, energy in SHM, general expression for SHM. 
36. Damping and Resonance: light, heavy and critical damping; natural frequency, resonance.


* I helped to start the Foundation Year programme in Physics more than two decades before I retired. It provided a route into the first year of a 'conventional' Physics degree for those students who, for one reason or another - for instance, having studied subjects at school which didn't include sufficient mathematics - didn't qualify for the more usual direct entry. In short, it provided a 'second chance'; I'm a big fan of second chances in education.

Friday 10 April 2020

Physics in the House


This is a post I'll be updating a lot (I hope). It's a collation of links to the short(ish) YouTube videos I've decided to try to put together during the COVID-19 lock-down. My primary target audience is the membership of my local U3A branch, but I've made the videos public, so ...
My original intention was to limit each one to ten minutes, but after the first half-dozen it became apparent that I'd never be able to keep to that. I've been told that twenty minutes is too long and I can't help but agree with that feedback. Similarly, I had hoped to avoid all equations but that has not been the case in practice; any that do crop up are very short. (I ought to add that there are also some maths. expressions appearing such as squares and square roots.) As if those failings aren't enough, I have spotted a few errors (none of which are too horrendous, and I correct most using captions within the videos themselves). My apologies to you, on all counts; I will try to do better.

The setup is very basic, as the stills included below will illustrate. The webcam is about a decade old, and my laptop isn't much younger. It's the same story with recording and editing software: I am using only the 'free' apps bundled within Windows-10 and those supplied as default with my smartphone. However, none of those facts provide an excuse for any poor content to the videos themselves or for my choice of topics - that's down to me.

1. Introduction.
2 minutes
My recording studio: a corner of my study, augmented with a 'camera gantry' made from a length of scrap timber G-clamped to a bookshelf. The A3 watercolour pad is so ancient that it's of little use  to my artistic wife, but it does well enough when used with a thick felt-tip pen; I'll replace it with a whiteboard as soon as I am able. In order to get my decade-old webcam close enough to the writing surface I have to slide myself under the makeshift gantry and wriggle into position in the small armchair. When the paper runs out I may have to treat myself to a small whiteboard ...

2. The Spin Cycle: what can we learn about the universe around us from our washing machine?
14 minutes

Watching the spin cycle is not terribly gripping, but I edited the clip down to a few tens of seconds in its final phase. Illumination (here and in other clips) was provided by a small LED torch - in this case it's suspend from the shoe rack to the left of the image.


3. Boiling Water: the sounds associated with boiling a kettle of water and where they originate.
27 minutes - ouch!
After a lot of trial and error (a lot!) I found that I could get a reasonable view of the kettle's insides by raising it on cork mats and hanging the webcam from the kitchen towel holder. I could illuminate the kettle by shining my LED torch through the water-level sight glass; it clatters off it's perch during one of the clips you'll see - I ended up propping it us inside a coffee cup. Sitting my laptop on the cooker hob didn't exactly represent best-practice, but it served its purpose. To reduce the issue of steaming up the webcam I had to fan vigorously ... using a magazine that happened to be nearby.

4. Water in Heating Systems: why is water such a good material within our central heating systems?
11 minutes
There's not much one can film when discussing a central heating system, so I chose to prop myself up next to a radiator and mount the webcam on an old camera tripod. At least the tripod made panning easier, but my arm did ache a little from the effort of holding up the A3 pad I was writing on.

5. Convection: from ice in warm water to the Sun.
17 minutes
Backlit in the morning light, diffused through some light curtains and propped up on a couple of books - high-tech all the way. During the phase of my career when I was visiting Grenoble (southern France, their 'Silicon Valley') for a week at a time to conduct one experiment or another I learnt a useful term for such set-ups: bricolage. I'm getting the hang of the video editing software bundled with Windows-10 at least.

6. Standing Waves: how the principle of superposition leads to standing waves and gives us music.
18 minutes
I'm no musician, but I can at least pluck a guitar string. There are two things to note in terms of getting things to work for this video: a) the trivial point that I now have a lap-sized whiteboard which ought to improve the clarity of my 'artwork' a little (powerpoint was invented for people with my drawing skills!), and b) the sneaky use of a bright LED bulb in my tiny utility room as a sort of strobe light (mains-powered LEDs actually switch from full intensity to completely off with the frequency of the mains - actually, twice each cycle, so twice 50 Hz = 100 Hz).

7. Visible and not-so-visible light: prisms, CDs and a drop of water lead into an exploration of the electromagnetic spectrum and the phenomenon of refraction.
17 minutes
Two of the props employed in this video: a plastic hypodermic taped to the top of my staircase, from which hangs a single drop of water, and a humble CD. There are a few posts on my blog of direct relevance to the material covered here - take a look if you'd like more information on colour, rainbows etc. Two of the most relevance may be found here:
Rainbows    Colour
You might also like to take a peek at a blog post written by a fellow physicist who's posts I make a point of reading: Bean thinking: Where entertaining science meets good coffee

8. The Swing of a Pendulum: how to explain it using the rotation of a record deck and then use it in order to measure the strength of gravitational attraction at the Earth’s surface.
17 minutes
Capturing the behaviour of our two wall clocks – both bought at small local auctions and then brought back into full working order – and a 200-year old locally made long-case clock was relatively easy, although the long-case clock required the webcam to be in portrait mode. Fabricating the 0.81 m pendulum and mounting it above my old vinyl record deck was more of a challenge.

9)  Crystal structures: taking a peek inside a few household materials to see how their constituent atoms are arranged.
14 minutes
I tried a slightly different setup this time, with the webcam looking past me to my desk. Apart from offering something slightly different for people to look at, it enabled me to have a few items of show-and-tell within easy reach. Spot the astronomy-based wallpaper on my PC screen - most of what's there at present comes from the Hubble Telescope, but I already have two of my own images in the folder and hope to add more in due course.

10) Interatomic Forces: using a simple elastic band to try to understand the key forces that hold materials together and control their properties and behaviour.
14 minutes
There have already been examples of the use of scraps of this and that employed in this series of videos but this setup is arguably the most ‘Heath-Robinson’ yet. Duct tape, a jar lid and a map pin get folded into this particular scientific instrument, along with an elastic band and a set of weights from an old, but still used, kitchen scale. It was all suspended from my 'camera boom', itself G-clamped to a bookcase shelf.
We can demonstrate Hooke’s Law and thereby to show that the bonds between atoms (and between molecules) behave as though they had the properties of a spring.
Although I decided not to spend time on it here, we could have set the weighted elastic band oscillating up and down; we could do the same with a suitable spring. Believe it or not, the maths. associated with that motion can be approached in the same way we did for the oscillation of a pendulum: we can 'recycle' the maths. describing uniform motion in a circle. Generically, we're in a favourite physicist's haunt called Simple Harmonic Motion. SHM informs much of our understanding about the motion of atoms within materials.

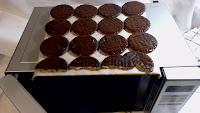
11) Estimating the Speed of Light using chocolate digestive biscuits (plain chocolate, naturally) and an old microwave oven.
17 minutes.
You may find it helpful to watch videos 6 and 7 before looking at this one; if you're OK with what the electromagnetic (em) spectrum is and what a standing wave is then do feel free to skip this step.
This is a demonstration experiment I had planned for the Canterbury U3A 2020 Open Day, but the whole event fell foul of the COVID-19 situation and was cancelled. I've slimmed it all down for this video taster. A notable change is that I would have done the experiment with chocolate buttons as originally conceived, but such non-essentials of life became very hard to come by and I resorted to the sacrifice of a pack of chocolate digestive biscuits instead. This has two major disadvantages: the chocolate softens quicker and makes it that much harder to get the times right, and the larger circles gives me a coarser surface coverage and also happen to have a diameter which is approximately the same as the distances I'm trying to measure. This second issue is the more serious of the two since it means that it's quite possible to miss one feature altogether: I know because that's exactly what happened. Thankfully, a more observant physicist who watched the first version of the video via a link I put onto Twitter sent me back to the proverbial drawing board and I tracked down the problem; thank you twitter.com/thinking_bean.
(The microwave oven itself was bought for next-to-nothing on eBay - it had dents and other marks all over the casing but the safety shielding was intact and it worked just fine.)


12) Microwave Ovens: what not to place inside them.
14 minutes.
Whilst I had my ‘disposable’ microwave oven already set up for Video (11) it seemed a good idea to use it for a second ‘fun’ demonstration. I’m always a little wary of telling people what not to do, but I hope that by actually explaining why something is not a good idea the message will come across in a more positive way. Please keep in mind that, although amazingly useful, microwaves have potential hazards associated with them if abused. In this case I was aware of precisely what might happen having seen the consequences of abuse in the past: I chose a single controllable demonstration and took appropriate precautions.

13) The Sun: what can we learn from our nearest star?
14 minutes
The image above shows my webcam with the lens covered by a solar observation film which removes 99.999% of the incoming light - if these are the sorts of precautions one must take in order to avoid damaging equipment then just imagine how much more important it is to protect your eyes from damage. OK, warning over. This video looks at what physics we might learn from observing the Sun. There's a passing reference to convection currents (see Video 5 in this series), and my earlier post on the Earth includes the following: "The Sun, which represents 99.9% of all the mass in the Solar system, is a ‘middle-aged main sequence’ star which means that it’s been stable for about 4 Gy – lots of time for life to develop. It resides in what we might term a ‘quiet suburb’ of our galaxy; we have no black holes or analogous threats in our neighbourhood, which is good. Our nearest neighbour galaxy, Andromeda (M31 in the formal catalogues) is actually heading towards the Milky Way at over 400,000 km/h – but because it’s 2½ million lightyears away we still have several billion years before it arrives."


18 minutes
Smoke detectors save lives - that makes them an example of a positive use for radioactive materials. In this video we'll take a look at how a domestic smoke detector works, and why one particular radioactive isotope is absolutely vital for this technology's operation. Of direct relevance is the blog post that emerged from my first Canterbury U3A session on radiation, which has now run a total of three times (I think) to progressively larger groups of members. (I confess that I was tempted to show you inside the ionisation chamber at the heart of this device, but I stopped short of that because I didn't want anyone thinking that it was a trivial thing to dissect the device.)

15) The Sound of Glass: what can it tell us about the arrangement of atoms within the material?
17 minutes 
If you run a search within this blog using the word "glass" there'll be many returns: I find glass an almost endlessly fascinating material. No surprise then that, for several years, I led a three-session series on the science and art of glass within Canterbury's U3A; it's 'resting' at present whilst I have been developing and running sessions on different topics within the physical sciences. If you prefer to watch a longer video in order to get more background invitation then there is an extended video on YouTube of a talk I gave many years ago at the Canterbury Heritage Museum: https://youtu.be/rH4e2aj-DO4
Although of no direct relevance, you may have noticed the image of the crescent Moon on my PC screen in the background during parts of Video 15. It's actually a composite of five separate images taken through my telescope sometime in April 2020. Did you know that there is a lot of glassy material on the Moon's surface and that this explains why it is so bright in our skies?

16) The Colours of the Sky: a spoonful of milk can illustrate more than you might think.
14 minutes
So many others have tackled this topic - I make no claims for originality - but I could hardly omit from our series a topic of such everyday importance as the blues and reds of our amazing sky. You might like to take a look at Video 7 in the series if you've not already watched it since it will give you an overview of where the colours we can perceive sit within the much wider electromagnetic spectrum. Also, there's a really elegant video demonstration of the same phenomena I'm attempting to illustrate here on the excellent Facebook feed of 'Thinking Bean'. The specific link is here
By the way, please forgive the untidiness of my garage ...
17) Refraction: why do the incoming waves curve near 'The Street' at Whitstable, and is it true that sound carries further at night?
16 minutes
In Video 7 we looked at the refraction of light through a prism and through a droplet of water, but in this video we'll take a look at one local manifestation of the principle ('The Street', a spit of land at right angles to the coastline at Tankerton/Whitstable) and one that we all might test out (why sound carries further at nighttime). There are many, many other examples of refraction in our everyday lives: our spectacles/contact lenses rely on it for instance, as do the lenses in our eyes. I'll leave you to explore: there's so much physics waiting to be found, even in our homes.
In the process of understanding these phenomena we'll get to something usually labelled in textbooks as 'Snell's Law', but ought Willebrord Snel van Royen be given this honour? For further reading on topics of this sort, i.e.  within the history of science, I recommend two expert and very readable bloggers: Rebekah Higgitt, who writes here and Thony Christie, whose blog is here. (Becky is a former colleague, having taken up an academic post after holding a senior position at the National Maritime Museum at Greenwich - we were both closely involved with our university's 'science communication/public engagement' activities.)
18) Diffraction: using a laser pointer, a perspex ruler and the spring from a biro we'll explore a method whereby physicists (and indeed a very wide range of scientists and engineers) determine the exact arrangement of atoms in a crystal.
18 minutes
I have been told that the sound level in this video is relatively low when viewed on a smartphone. I'm sorry about this.
In Video 9 of our series we looked at crystal structures - the arrangement of atoms in everyday materials like table salt, aluminium, etc. - but how are these atomic-scale structures determined?  One of the most powerful methods is diffraction, which is what we focus on here. The majority of diffraction experiments rely upon a bright source of x-rays, which are an energetic, short-wavelength form of light (see Video  7) but we can use other probes as well such a neutrons or electrons - both of which are commonly thought of as particles, but which can behave in a wave-like manner just like x-rays. In this video we'll illustrate the diffraction method using 'scaled-up' analogues. (The COVID-19 virus has been studied using the methods illustrated here.)
One thing I simply forgot to talk about in the context of my illustration of diffraction from DNA using a helix in the form of a metal spring, is the significance of the angle of the 'X' we observed in the pattern. Just as the spacing between markings on my perspex ruler determined the spacing between the bright patches of scattered light we saw on the graph paper - the more widely spaced the markings, the closer the patches of scattered light - so the angle between the lines of the cross is determined by the pitch of the helical spring. The point being that diffraction not only gives us information on the spacing between atoms but also, in the case of molecules such as DNA, offers us an insight into the overall shape of the molecule's structure - the pitch of the helix in DNA's case. A copy of Rosalind Franklin's original x-ray diffraction image from DNA, recorded on photographic film, is shown above on the right; note the 'X' shape. (Image taken from https://en.wikipedia.org/w/index.php?curid=38068629 - accessed 23/5/20).
19) The Galileo Thermometer: using buoyancy to measure temperature.
14 minutes
Galileo thermometers are available in all sorts of styles and sizes (and with associated costs); this one was a gift and has graced our dining room for many years. The chap depicted in the background is supposed to be Galileo Galilei himself. I hope the video explains how it works well enough, despite my evident failure correctly to spell 'buoyancy'.
20) The Siphon: a little gravity-driven physics in your WC.
20 minutes
How could we leave the topic of 'Physics in the House' without flushing out the secrets of the WC: what happens when the lever is twisted, and more importantly, why? There have been all sorts of things written about its workings, from suggesting that, once started, the falling water 'pulls' the water behind it through to the supposed driving force of atmospheric pressure. We'll see that all we really need is gravity. 
I've tacked on about five minutes on the topic of atmospheric pressure by the way. The topic caught my eye as I was researching the operation of siphons in toilets and doesn't really warrant a whole video to itself - especially in a series under the heading 'in the house'. Having said that, it's a fascinating story in science, with lots of intriguing history, so you might want to do a little reading yourself.
21)  Why is Glass Transparent - or is it?
20 minutes
My blog is replete with posts on glass: some tackling aspects of the science of the material head-on and some taking a more oblique path. It will be obvious to anyone scanning my writing that this is a material that fascinates me more than any other as a scientist. If you've had the misfortune to sit through one of my multitude of talks on the science and art of glass you'll know that my passion knows no bounds and that, as a consequence, I sometimes stretch the limits of my allotted time-slot. The final two decades of my research career were dominated by chasing its secrets into some exciting new avenues (e.g. bio-active glasses for bone regeneration and for drug delivery). It is perhaps fitting, then, that I draw the 'Physics in the House' series to a close with a video related to 'everyday' glass.
____________________________________________________


An introductory video and then twenty science-based studies derived from things in/around the house (well, my house) meets the target I set myself at the outset. Five and a half hours in total: that's getting on for the aggregated total of face-to-face time I would normally spend each year leading Canterbury U3A groups. Now that 'lockdown' is dissipating it is perhaps time to draw a line under the project; in truth, I have covered most of the topics on my original list of ideas - and a few more besides. 

However, before I sign off I'll mention a full-length recording of a talk on glass I delivered to an audience in Canterbury's former Heritage Museum way back in 2012. I have been 'resting' my three-session glass science & art U3A course for a couple of years as so many of the membership have already participated. If anyone would like to see a slightly outdated summary then do watch 'Glass: a look inside'.

Physics Beyond the House
Also, I plan to add to 'Physics in the House' a new series of videos. Way back, when I was still reaching Physics as a university academic, I taught courses for Foundation Year students - those who, for one reason or another, wouldn't get a place in the first year of a conventional Physics degree programme without spending time being brought up to speed. (For example, some of the intrinsically bright students on the course will have taken the wrong mix of subjects in their final years at school for a Physics degree.) The course content was, therefore, roughly at the equivalent level to the UK 'A'-level. I was an early adopter of recording technology for lectures (see my blog post 'Flipping Lectures') - one result of which is a library of lectures I have as video podcasts, archived from one particular academic year.  STOP PRESS: see the following blog post for details, here.