Tuesday, 14 January 2020

Messing around with Sound


In fairness to you dear reader, I ought to open with a confession: this post contains many more words than I’d usually aim for. In order to mitigate this I have moved several hundred words to an [endnotes] section so you only need read them if you’d like a little more detail/information. I’ve told myself that it may prove useful for anyone else thinking of giving a talk to a lay audience on the same topic; who knows. In addition there are, sadly, few pretty pictures to soften the blow, but I have added lots of links to animations and the like …

For the first three years of my retirement – from academic life that is, I was a scientist before that, and I still am – I led three two-hour sessions, one per week, on the art and science of glass for my local University of the Third Age (U3A) branch. (It has over 1000 members, making it one of the larger branches on the UK scene; the web site is here to which I contribute the odd snippet now and again, here.) It was huge fun, due in no small part to my audiences of smart and careful listeners. In the process, I got the opportunity to develop further whatever skills I had in conveying aspects of science without the use of mathematics. However, after the 2018/19 season I decided to set this material to one side for a while. We all need new challenges from time to time, when the old must make way for the new. I had by this time developed a session on the topic of ‘Radiation’. This was a start, but my plan, such as it was, involved introducing new topics on a rolling basis. Accordingly, in the following year, I successfully trialled a session which explored the question: ‘What’s so special about the Earth?’. After that – and we’re now into the current, 2019/20, season – came sessions on ‘Colour’ and on ‘Sound’. Where I go from here is undecided [i], although it’s definitely time to lay ‘Radiation’ to one side for a while as everyone who wants to learn something under this heading has by now been able to. (I know this because, unlike my other sessions, there wasn’t a waiting list of ‘reserves’ hoping to get a seat on the basis of a last-minute drop-out.)

All of this is but a preamble to the central reason for writing a blog post after a relatively long hiatus. Put simply, I promised to draft something on the topic of ‘Sound’ [ii] in the hope that it would act as a sort of memento for those brave souls who risked contracting my cold virus in order to participate in the session on January 7th. (And participate they did by the way: every bit as sharp-witted and engaged as any other U3A group I’ve encountered, and with a great sense of humour – more of that later …) 
As a bit of fun, whilst I was busying myself setting out the various bits of kit I’d borrowed [iii] for the event, I projected onto a large TV monitor the live ‘oscilloscope’ trace [iv] of the sounds present in the venue as people arrived and settled down to chat to each other. It was fun to see the realisation dawn that it was they who were creating the changing ‘squiggles’ on the screen. (The screenshot shown in the figure above was not captured at the time but specifically for this post – it’s derived from a piece of music I played for the purpose – but the principle holds.) This pre-session bit of ‘show and tell’, which I explained to everyone later on, worked particularly well because we were in a relatively small room with hard walls and large windows bouncing the sound around. Unfortunately, this would make life less easy for later demonstration experiments. A partial solution involved dropping the wood-slatted venetian window blinds and angling the slats in the hope that any echoes would be broken up a little. It worked tolerably well. Even with the same slides and associated ‘show & tell’ kit, no two talks are ever the same; it’s part of the fun of the whole process.

Sound was of course listed in the relatively short Science section of our U3A programme of events for the year – science-related topics represent about 10% of the total – so we started with a bit of basic terminology and a few definitions in order to get the ball rolling. A key concept was that of an oscillation: a repeated to and fro motion. All waves are oscillations. (Hence, a ‘Mexican wave’ is not actually a wave at all – it’s a pulse.) Having got that under our belts it was possible to focus on sound waves and to illustrate what was going on by considering the to and fro motion of air molecules in front of a loudspeaker cone. As the cone moves forwards it compresses the air in front of it (i.e. increases the pressure) and as it moves back again it causes the air pressure near it to decrease; the air molecules are oscillating backwards and forwards. In colliding with the next layer of air molecules this oscillation is propagated outwards; all the while, individual air molecules are simply oscillating forward and backward, forward and backward. The animation shown here illustrates the behaviour quite well. Of course, sound travels in liquids and solids as well; the same generic principles pertain, but the atoms/molecules are closer together and tend to be bonded to one another far more strongly than is the case for air molecules. The speed of sound in dry air at 20ºC is 343 m/s (at 0ºC this drops to 331 m/s [v]; humidity also has a significant effect) but in helium gas it’s a whopping 965 m/s, which is why one’s voice sounds high-pitched after inhaling helium. The speed goes up again in water (for seawater it’s about 1522 m/s) and leaps up again in solids to several thousands of metres per second. As a passing observation, the variation in the speed of sound through different materials is what enables geologists and geophysicists to use the technique of seismology to such good effect – but to explore that would require another blog post.

We looked at what was meant by sound frequency – the note or pitch – and then at the difference between intensity and loudness, the latter being the subjective response of our ears and brain to changes in the intensity of sound waves arriving at our eardrums. This enabled us to get to grips with the oft-quoted unit of the decibel as a measure of loudness. It was also a great point at which to reflect on what an amazing instrument the ear actually is: capable of detecting frequencies from a few tens of oscillations per second (one oscillation/s is called a Hertz, Hz) to around 18,000 Hz, and able to do so over twelve orders of magnitude in intensity [vi]. Interestingly, a baby’s cry is at a higher frequency than an adult’s, about 500 Hz compared to ~350 Hz, which corresponds much more closely to the frequency range at which an adult’s hearing is most sensitive. The obvious experiment was to use one of my borrowed signal generators to send sound waves of a particular frequency from a loudspeaker and to vary the frequency in order to determine the range enjoyed by those present. No-one got much below 40 Hz or, with a couple of exceptions, higher than about 14,000 Hz; our ears degrade with age.

There are sounds we will never hear of course. At high (ultrasonic) frequencies we know that bats are able to echo-locate their food, and in the medical world we design instruments to image parts of the body, break up unwanted lumps and so on. At the other end of the scale, low (infrasonic) frequencies are associated with elephant and whale calls as well as with the blades of wind power turbines. There are occasions when the frequency (or equivalently the note or pitch) of a sound seems to change all by itself. It’s most obvious when an emergency vehicle is travelling towards you and then passes by and travels away: the frequency seems higher on its approach and then drops as it travels away. This is an example of the Doppler Effect (see animation here). It was demonstrated in a simple but quite dramatic way by fixing a small speaker (from a printed circuit board) to a battery via a switch and twirling the whole thing above my head in a circle. The frequency (pitch) of the sound as heard by my lovely audience increased or decreased depending on whether the source was approaching or receding from them.

Our next keyword was ‘superposition’. Although an extremely important principle across Physics, it has particular ramifications in the context of sound waves. Basically, we can think of overlapping sound waves as adding together in a very simplistic manner: if an increased pressure bit of one overlaps an increased pressure bit of another, the result will be an even higher pressure; if an increased pressure section of the wave were to overlap with a reduced pressure section of another however, they would tend to cancel one another out. This may be illustrated in practice in several ways, but I started with beats. This occurs when we hear two sound waves which differ slightly in terms of frequency – usually by less than 10 Hz: we end up hearing only one frequency, which is the average of the two, and its intensity goes up and down. Twin-propeller aircraft are famous for giving rise to this effect. In our case, I was able to demonstrate the effect by running two loudspeakers from separate signal generators and then slowly varying the frequency of one of them so that it approached and went past the frequency of the other. This set of animations may help.

We then came to a really fun bit, when I got everyone to stick a finger in one ear, stand up, bob down and move around the room. It was quite a sight. We were talking about the creation of an interference pattern using my two loudspeakers, but this time powered from a single signal generator to ensure that they were perfectly matched. It’s a tricky concept, but this animation reveals the essence of what we created, in 3D, using two sound waves. What we established was a stable room-filling pattern of high and low intensity sound through which we might move. I chose a frequency in the region of 1500 Hz for this simply because I knew it would provide a pattern spacing of less than half a metre. Why the need to block one ear (or remove one hearing aid in a couple of cases)? So that we could explore the sound interference pattern without the confusion of having two ‘detectors’, our ears, send separate signals to our brains. After a few minutes of fun, and a bit of discussion on whether one could navigate around the room by counting the number of high/low intensity regions we had moved through, I asked everyone to park themselves at a low intensity point. If we were experiencing what I had told everyone we were, then by unplugging one of the loudspeakers the sound intensity at their ear – their sound detection device – ought to go up. Thankfully, everyone was able to confirm to me that it did. 

Resonance was to be my final topic. Although we were able to cover the basics – the necessity to ‘drive’ the system at its natural frequency – we ran out of time before I could set up the coup de grace: smashing a wine glass using only sound. My laptop’s soundcard scope came to fore again in that I could at least show everyone how to find the natural/resonant frequency of a wine glass simply by flicking its edge with a fingernail. The screenshot of one I had tried at home is shown above: the glass rings at a particular frequency/note. In this case – indeed, for all the odd wine glasses I possessed – the natural, or resonant frequency was in the region 870 Hz. Subject the glass to a high enough intensity of sound at that same frequency will cause it to vibrate more and more … until it breaks. This video shows precisely the arrangement I had intended to use.

From the questions posed at the time and from subsequent kind and generous feedback I’m clear that were there more time, those present would also have enjoyed to hear about why musical instruments sound so different even whilst playing the same note, including what makes a standing wave. Perhaps next time. All I could leave them with as our session came to its end was a warning and a piece of prose:
  • beware sounds at 5-7 Hz as this corresponds to the resonant frequency of our body’s water-filled cavities (- an important consideration when designing car suspension systems, and otherwise) and
  • enjoy George Eliot’s appreciation of resonance: “How will you know the pitch of that great bell too large for you to stir? Let but a flute play ’neath the fine-mixed metal: listen close ’till the right note flows forth, a silvery rill: then shall the huge bell tremble – then the mass with myriad waves concurrent shall respond in low soft unison.” (Middlemarch, OUP, Oxford).
_________________________________________________________

Endnotes:
[i]  Is there scope for something on waves, or on quantum mechanics? What about an open Q&A session: could I pull together a sufficiently multi-disciplinary team who would volunteer to join me in the ‘bull pit’, and would there be an audience? Ought I to step sideways out of the U3A and into something qualitatively new? There are lots of possibilities, but as yet no decisions. 

[ii]  Indeed, there are blog posts on each of the topics I’ve covered within the U3A thus far with the sole exception of ‘Sound’, so it’s surely got to happen. Existing posts may be found by clicking on the following links: Radiation (here), Earth (here), Colour (here and links therein); Glass is at the heart of half the posts on my blog, so take you pick (e.g. here or here; or if you’d like to peek into my professional interests in glassy materials, try here). 

[iii] I am immensely grateful to my old department (The School of Physical Sciences, University of Kent) for their continued support in my science communication endeavours, and in particular to ex-colleagues Dr. Dave Pickup and Dr. Vicky Mason. I made sure to acknowledge this support in my talk, as is my habit whenever I use borrowed items for ‘show-and-tell’. 

[iv]  I used a piece of software which is freely available to download for use within non-commercial/educational contexts (here). It uses the laptop’s soundcard, so it does have limitations of course; however, it is extremely useful for talks such as this one.

[v]  I’ll not cover it here, but this is the reason why sound carries further at night. The cooler air near the ground has the effect of refracting (bending) the sound waves downward – thus, the sound wave’s energy is not dissipated up into the atmosphere quite so much. In the daytime, when the air near the sun-bathed ground is warmer, the waves are bent upward and thus away.

[vi]  From 1 W/m² to 1 pW/m² where W, the Watt, is a measure of the wave’s energy and a picoWatt is one million millionth of a Watt. For context/comparison: the heat output from a single adult is in the region of 100 W; a domestic electric kettle typically consumes power at a rate of 2,000-3,000 W. The ear is thus a very sensitive wave detector. 


Friday, 6 September 2019

Evecrumble: teaching physics from a galaxy far, far away


The prompt that got me off the sidelines in order to break a six-month hiatus in blog-posting was a conversation with my thirty-something son. He was telling me that one of the online games he used to play ‘back in the day’ was being re-released in its original form in response to prolonged lobbying by older gamers. Apparently these old-school players wanted to roll back the changes which, they feel, have made the game too easy. Thus, the classic version of ‘World of Warcraft’ is wowing its loyal fans even as I type. However, the current exploits of his balding Guild are not what I want to write about here. How could I, given that I know near-to-nothing about the game. No, what the conversation actually reminded me of was another game he used to play a lot: 'EVE'. EVE is set within a simulated space-based environment that attracted – and presumably still attracts – those who value the potential for internet-based gaming that relies on alliance-building and calculated risk-taking. I can remember listening with admiration outside his door to the disciplined voice traffic of the Corp and corp alliances my son played within as they organised and managed themselves: players from four or more countries and time zones learning the art of cross-border collaborative effort. He was evidently exceptionally good at it if one can take the entry from the Urban Dictionary I show below as any guide. But I digress …
My son chose the name Evecrumble for his online avatar. 

This image is a screen capture from urbandictionary.com
My real reason for drafting this post is that I was reminded once again that physics is everywhere – and that computer games are therefore fair game (sorry!) as sources for teaching material. I’ve already written in general terms about my exploration of university-level teaching using novel approaches (see here) and I’ll not repeat that content other than to mention the use of TV, film, novels and the press. With a great deal of student input to the process, I began compiling and using a library of physics-related snippets from a range of sources familiar to class members. A journalist in the USA heard about it; the story made the front cover of the magazine, which was nice – both for me and for the students who’d had a constructive input.
Science News was, and I believe still is, an American science magazine published by the Society of Science and the Public.

It just so happened that, whilst all this was developing, Evecrumble began to make videos centred on his various multi-national Corps’ activities. What a gift: now I could add online gaming to my portfolio of teaching aids. Armed with a CD copy of one such video I would encourage groups of students to watch, analyse and then voice their appraisal as physicists.
An excerpt from one of the game-play videos created by Evecrumble


This really is rocket science, of a sort. Watch a few minutes and see what you can spot – good, bad or ugly – that might prompt a question or two about the physics of the game. You’ll ideally need a full-sized computer screen since the tactical displays are small, and a darkened room (space is black); sound is optional. The full-length video runs for about 15 minutes; I have extracted about six minutes. Each of the campaigns portrayed will probably have lasted for several hours in ‘reality’.

Between them, and across the several years I used it, my lovely students found much to praise:
  • the gas/dust clouds illuminated by stars within – might there be star formation occurring? See my post here for more;
  • the fact that spaceship trails appeared curved as they altered course – the exhaust will leave along the axis of the ship from moment to moment; thus, as the ship turns the trail will appear to curve. This is reminiscent of the creation of cometary dust trails: the comet’s path might be an eccentric ellipse around the Sun, but the ‘engine’ propelling the dust is the solar wind and so the direction of the comet’s travel and that of its trail will not coincide.
  • The conceptual design of spacecraft and of space stations created much discussion regarding the lack of frictional forces and the effect of reduced/micro-gravity on freeing one up to move beyond streamlined shapes. There have been plenty of images in the press/media of late marking the 50th anniversary of the first manned landing on the Moon: immediately obvious is the fact that the LEM (Lunar Excursion Module – the bit that actually landed, part of which later took off again; see NASA library image below) could be light and ‘spindly’. It’s a bit of a tangent, but I wrote about the effect on my interests and passions of things like the Apollo programme in a previous post, here.

There were also areas in which the students discerned more than a little ‘licence’ on display; indeed there are certain aspects that would make most physicists wince:
  • A whole swathe of these relate to the confusion between weight and mass: mass is intrinsic to any physical entity but weight arises from the action of gravity on the entity’s mass. For example, like the LEM shown above, whilst a spaceship need not adopt a streamlined (aircraft-like) design, its movement will still be affected by its shape – specifically, the distribution of its mass. The same formulae describe moments of inertia in space as pertain here on Earth: try to rotate the ship/station and those parts furthest from its centre of gravity will exert the most force on the connecting struts or framework. Now that I’ve introduced the ‘g word’ we need also to consider the matter of effective weights: as Einstein pointed out, an object which is being accelerated will, in effect, increase in weight. You can try this yourself the next time you travel in a moderately fast lift, although this is an experiment best tried in the company of understanding friends. You’ll need to fool your legs that there’s nothing unusual about to happen by walking gently around the lift before it takes off – we tend to tense our muscles without thinking and it’s important to avoid that. When the lift starts up, it will accelerate you up to its nominal rate of ascent; in that brief period of acceleration your legs will sense a heavier body above them. Exactly the opposite will happen as the lift begins its descent: the acceleration is now ‘negative’, and it feels like a weight loss. Our bodies are quite sensitive to acceleration. Acceleration is able to induce something akin to the effects of of gravity: it gives the objects an effective weight; they always possessed a mass, but now that mass is being accelerated and the object behaves as though it has weight. Einstein Theory of General Relativity showed us why it is that the forces created by gravity are actually indistinguishable from those generated by acceleration. EVE, and a very large proportion of all space-based science fiction, sets this aside by and large. (It’s the same with ‘super-hero’ stories.) Examine the rates of acceleration in EVE and it becomes apparent that the humans within each ship would not survive: the forces dwarf those experienced by Apollo astronauts.
  • Another major issue is the need to slow down in space in order to bring your journey to an end. The fastest way from the proverbial point A to point B is to accelerate constantly for the first half of the journey (during which time the occupants will feel something indistinguishable from gravity remember) and then decelerate equally hard* for the second half. Only then would you come to a standstill at point B. In EVE, as is common elsewhere, the assumption is made that closing an engine down will bring the spacecraft to a halt. The truth of the matter is that the ship would continue onward at whatever velocity had been attained when the engine was turned off since there are no frictional forces – in other words, rocket engines firing in the opposite direction are needed in order to slow down. EVE goes further, as you’ll see in the video, by showing us ships with engines still running but which are nevertheless reducing speed.
  • Beyond these topics came discussions on 'jamming' electromagnetic signals, hyperspace/warp drives and technology like the rail-gun. Students also picked up on the choice of units used: AU (an Astronomical Unit is the average distance between the Earth and the Sun) and m/s. Pick a scale folks! (See my earlier post here.) 
Good or bad, the screen footage of game-play served its purpose well by engaging students in reasoned discussions on Physics and for that I was more than satisfied. And when all’s said and done it’s only a game, isn’t it …?

Evecrumble herself, together with a couple of Corp logos from the time.

P.s. I’ll recount one extra interaction with a student, who got very excited when I told the class what was coming as a break from ‘Hollywood’ and the news media. His first contribution when I finished showing an approximately three minute excerpt was to ask whether Evecrumble was me. The look of expectation on his face was very special, but it turned to resigned disappointment when I said that I didn’t even play video games. However, he perked up when I said I knew Evecrumble quite well. He asked me to convey a message: “I was once in that Corp. Please tell Evecrumble that it was an honour to have served with him.” Perhaps it's not 'only a game' after all. I expect my face was a picture at that point; my son’s certainly was when I passed the message on. The choice of pronoun is also interesting. My son had quite purposefully created a female avatar for one good reason or another, evidently to no avail.


Footnote
* I am ignoring the fact that the ship’s mass is changing due to fuel loss. Having said that, if an ion drive is being used (see here) there may well have been refueling events en route – perhaps by collecting H2O from a passing asteroid/comet. Such thoughts would require another blog post to consider properly …


Thursday, 14 March 2019

Only in Moonlight


A major exhibition in The Turner Contemporary Gallery, in which selected works by JMW Turner (about whose theories of colour I wrote, here) are set alongside work by Scottish artist Katie Paterson, runs until May 6th 2019. There is an excellent five-minute video introduction to the exhibition here. I should be honest from the start: it was a bit of a geek-fest for me. I liked some of the individual works simply as pieces of art, don’t misinterpret me, but fathoming out the many links to astronomy, planetary science and so on rapidly took on the nature of a mild obsession. However, I had an unusually specific reason for wanting to spend a few hours taking in this particular exhibition …
One of the first images that caught my eye as I entered the exhibition space was this curiously coloured image towards the centre of the Milky Way. Its title is ‘Colour Field’(Katie Paterson, 2016). The artist had first removed all colour information – which had presumably been derived from combining original astronomical images recorded through specific colour-band filters – and then added back colour derived from a Los Angeles cityscape. In this one image we have a clear statement of the fact that we, and our cities, are all made from the atoms of our host galaxy.

Way back in January 2013 a colleague and I were chatting with the head of Turner Contemporary’s Learning team when the conversation veered off at the sort of angle that sometimes leads to serendipity. We were engaged in an experiment to bring together scientists and artist to discuss an up-coming retrospective exhibition of sculptures by Carl André (here). Although there was a slew of interesting outcomes – including invitations to take part in future interdisciplinary projects with Turner Contemporary – one tangible output from this engaging exercise was the brief animation available here. This ‘side road’ within our conversation concerned a proposal to send a ‘meteorite’ into space. The artist, we were told, was seeking funding and facilities from the European Space Agency in order to send a chunk of re-caste meteoritic material back into space “in a celebration of science, art and human technology”. The artist in question was of course Katie Paterson – and her proposal to ESA resulted in a fist-sized chunk of meteorite being ferried to the International Space Station in May 2014. The ESA web site has a write-up here. I would have loved to have been involved in some way, but a chemical physicist/materials scientist like me could never have provided the sort of expertise she needed. Having now seen the exhibition of her work, including the piece associated with her ‘meteorite’ proposal, I am doubly disappointed because I suspect I’d have learned a lot from collaboration with her. (I was, it must be said, up to my neck in my ‘day job’ as an academic at the time so, in truth, it would have been a difficult project to fit in.) Thus, a fascinating conversation and follow-up email evaporated away … until the doors opened to this exhibition.

The obvious exhibit to focus on in this context is ‘Campo del Cielo, Field of the Sky’ since that derives from her work with metallic meteoritic material. My photo of the piece (taken with permission, please note) is shown below. This piece derives, apparently, the largest of a set of five iron-based meteorites; it was the smallest meteorite that was used for the trip back into space aboard an unmanned supply shuttle to the International Space Station. The original meteorites were approximately 4.5 billion years old – as one might expect given that this is the age of the solar system and thus the bodies within it. In passing, the recent missions to comets and asteroids relate to bodies which are of comparable age; unlike the other rocky planetary bodies we’ve explored ‘up close’ – Earth, Moon, Mars, Venus – these smaller wanderers remain largely unchanged since the solar system was formed. Hence the scientific value of missions such as NASA's Stardust (here) and Japan’s Hayabusa (here) which were designed to collect pristine material and return it to Earth, and the expectations associated with the next generation of missions already underway. Katie Paterson’s idea, which is what I heard about way back in 2013, was to take a cast of these iron-based meteorites and then re-melt them into their casts. We therefore have a remnant from the early period of the solar system’s existence which has travelled to Earth and thereafter been transformed by the artist’s conscious intention into a version of itself before being sent back into space, albeit in near-Earth orbit. 
Campo del Cielo, Field of the Sky by Katie Paterson (2012-14).

Iron-based meteorites do in fact contain other metals, such as nickel (both metals are amongst my favoured elements – see here) and may well have minerals within them as well. They are mostly the remnants of ancient asteroids, the more volatile parts having melted away to leave only the densest material as a residual core. For an overview of these and other types of meteorites I recommend the Natural History Museum’s website, here. Melting an iron-based material requires a furnace capable to reaching temperatures in excess of 1538ºC; I’ve done it, using a home-made furnace during my PhD in the mid-70s; it’s not easy.

Three other pieces amongst a host of thought-provoking items in the exhibition particularly excited my inner scientist: two by Katie Paterson herself and a cabinet of work by Mary Somerville and Caroline Herschel. The two contemporary pieces used sound and light to encourage a novel look at our relationship to the Sun and to the Moon. ‘Totality’ fills an otherwise gently-lit room with bright reflections from a rather special rotating mirror ball, illuminated by a couple of spotlights. Walking slowly through the moving 3-D pattern of reflections was quite disorienting – a fact which serves merely to pique my interest. Key to the piece is that the ‘mirrors’ on the ball are derived from images of solar eclipses, originally recorded over a span of time from the present day back through early nineteenth century photography to drawings made centuries ago. Using headphones, supplied by the ever-friendly gallery staff, one may augment the experience by listening to one of two audio pieces created by the artist to complement the piece. Then there’s the automated Steinway grand piano which sits – or perhaps that should be plays – at the heart of ‘Earth-Moon-Earth’, which is installed in the same room as the Totality mirror ball. The concept of piece is ostensibly fairly straightforward: Beethoven’s Moonlight Sonata was turned into Morse code (- a process I would have liked to have had more information on) which was transmitted to the Moon. The reflected signal was turned back into a musical score and output via the piano. The surface of the Moon is such that the signal is altered on its return. Whole notes are missing, sometimes several in a row, and this creates an intriguing pseudo-new sonata in which the pause becomes integral to the whole. As a probe of the Moon’s cratered and mountainous surface, this artwork provides one of the most novel methods I’ve come across.
Totality, by Katie Paterson (2016).

Earth-Moon-Earth (Moonlight Sonata Reflected from the Surface of the Moon),  by Katie Paterson (2007).

Finally, I couldn’t help but mention a cabinet containing a few opened books containing the original notes of observations made by the astronomer Caroline Herschel. These include the page shown below on which she records discovering her first comet (1st August 1786), and a corresponding letter to the secretary of The Royal Society containing the news. Alongside these sat examples of the enormous number of numerical calculations she undertook – published, it is sad to note, in her brother’s name because of The Royal Society’s rules as they were at the time. She was a contemporary of the talented mathematician Mary Somerville, some of whose work is also shown. 


Who says art and science can’t communicate! Personally, much of the creative writing I’ve delved into since ‘retiring’ remains informed by my experiences as a scientist: like so many others, I write out of who I am, often to make sense of my own thoughts. Coincidentally, a longer piece I started a couple of months ago, currently set aside for a season, includes an astronomer looking back to the Earth from the Moon. She stands bathed in Earthshine.


(If you’re interested, there are several posts in this series in which I describe some of the opportunities I’ve had to explore the hinterland between these pursuits, unfortunately treated as disparate in recent decades.)


Tuesday, 10 July 2018

What’s so special about the Earth?


Image adapted from NASA’s public-access library (www.nasa.gov)

I set myself a challenge earlier in the year: to put together a talk for our local branch of the U3A (see here for details) highlighting some of the combination of factors which foster the life that abounds on our planet. What is it, from the perspective of a physical scientist, which helps to make this ‘third rock from the Sun’ into a jewel? Meeting this goal turned out to require significantly more time and thought than I had bargained for. It’s a topic that has intrigued me since taking an optional course in geophysics whilst I was an undergraduate Physics student in the early ‘70s. However, getting stuck back into some reading – actually, quite a lot of reading – and trying to craft an equation-free talk which would encapsulate some key areas for a group of intelligent non-specialists needed all my creative ‘muscles’. Hindsight assures me that this was no bad thing as I learned a lot in the process. What’s that old saying? ‘If you want to understand something better, teach it’, or words to that effect. So true.

Rather than consume paper (and toner) generating hand-outs for my lovely U3A participants, I decided to post the core of the material on this blog so that they can access it at their leisure. Given its motivation, the post is almost necessarily on the long side, and it’s information/fact-heavy, so you may want make yourself a nice brew before you sit down to read it. The act of publishing this synopsis may of course mean that, were I to offer the talk again next year, no-one would register because it would be easier simply to read this post. However, my experience of making notes available to students, or even of audio/video-recording lectures during the latter decade of my career (see here), tells me that a good (!) ‘live performance’ will always draw people in. Numbers didn’t drop off at all back then, and I’ve no reason to think that a mere blog post would do anything similar now; so, here it is …

After introducing myself, and making it clear that this was not an area of particular expertise – not itself an issue within the U3A framework since it’s designed to foster a form of community learning – we took a look at where we are. Starting at the scale of the Milky Way, our home galaxy amongst the billions of others to have formed since the Big Bang, we zoomed in to the Solar system. Not that ‘zooming in’ seems entirely sensible in this context, but it does help to set the scale of things. Having established where we are and the approximate size of things, the next obvious question relates to how the Earth and other planets came into being. I’ve touched on this in an earlier post (click here) so I won’t needlessly take up space by repeating it. There is, however, a piece of news hot-off-the-press which does need to be added to this earlier account. On 2nd July – so a few days before this post was drafted in support of my U3A talk, the European Southern Observatory issued a press release (available here) outlining the first confirmed direct observation of a planet in formation around a dwarf star. 

Our Solar System: Note the distance scale: our ‘measuring stick’ is the distance between the Earth and the Sun (150 million km, called an astronomical unit – AU). On this scale, the dominance of the Sun’s magnetic field and the Solar wind extends beyond the planets to about 100 AU. Travelling at prodigious speeds since its launch in 1977 (currently in excess of 17 km per second) Voyager 1 only reached this region in 2012. There is a diffuse orbiting collection of cometary material called the Oort Cloud, left over from the birth of the system, a further factor of 100 beyond. (Image: photojournal.jpl.nasa.gov/catalog/PIA17046)

The rest of the talk served to explore the beneficial consequences to life of a few key facts:
  • Our Solar System is only 4½ Gy (billion years) old, which makes it quite young in the context of the time since the Big Bang (13.8 Gy). The lyric from the 1960s musical ‘Hair’ becomes apt at this point: “we are stardust, we are golden”. The point being that there have been multiple generations of stars before the Sun, many of which exploded towards the end of their lives as supernova and in the process created all the heavier elements of the periodic table. These new types of atoms were blown out across space, eventually to be incorporated into planetary systems around later generations of stars. New stars are still being formed within the Milky Way. 
  • The Sun, which represents 99.9% of all the mass in the Solar system, is a ‘middle-aged main sequence’ star which means that it’s been stable for about 4 Gy – lots of time for life to develop. It resides in what we might term a ‘quiet suburb’ of our galaxy; we have no black holes or analogous threats in our neighbourhood, which is good. Our nearest neighbour galaxy, Andromeda (M31 in the formal catalogues) is actually heading towards the Milky Way at over 400,000 km/h – but because it’s 2½ million lightyears away we still have several billion years before it arrives. 
  • The Earth is a rocky planet with a molten core, travelling in a near-circular orbit around the Sun with an average radius of 150 million km; one complete orbit takes 365¼ days. All of which tells us that, given the energy output of the Sun, we’re at just the right distance for there to be liquid water at the planet’s surface – if there’s any water present that is. This relatively narrow band of distances from a star is often referred to as ‘The Goldilocks Zone’; Venus and Mars, our nearest neighbour planets exist right at the inner and outer fringes of the zone respectively. Moreover, whilst a highly elliptical orbit might take us repeatedly in and out of the zone, our near-circular orbit keeps the Earth within it all the year round. If the Sun were to be cooler than it is – and there are plenty such stars out there – the Goldilocks (or ‘Habitable’) Zone would have a smaller radius. Planets close to their star tend to have very short ‘years’ and are often locked into having a single face pointing towards the star (- much like the Moon with respect to the Earth: we only ever see one face). This means that half the planet’s surface would be warm and the other half cold – even if there was an atmosphere, the weather patterns would be quite unlike our own and one might even see any water present condense on the cold side. 
  • The Earth has a radius of 6,378 km at the equator and mass 6 x 10²¹ metric tonnes (6000 billion billion). This tells us immediately that it has the sort of density that allows such phenomena as tectonic plate movement to occur. Venus, for example, also has tectonic plates, but their density is such that subduction apparently does not take place; this is the process whereby one plate ‘dives’ down below another as they drift towards each other, generating life-giving volcanic activity for instance. Tectonic plates form a crust on the Earth’s surface and move because we they float on a molten core beneath. This fact implies that the Earth’s temperature, beneath its surface layers, must be high enough to create and maintain the molten magma. Some of this heat energy derives from when the Earth was formed out of the violent impacts between dust, asteroids and comets – there hasn’t been time for it to have radiated away into space yet – but at least half of the heat energy comes from continuing radioactive decays. Which fact takes us right back to the benefits of being formed relatively late in the life of the universe such that all these usually heavy radioactive elements, like uranium, had already been created and spread by earlier generations of stars exploding as supernova. 
The Earth’s mass is high enough for us to hang on to an atmosphere, unlike Mars which has lost much of its atmosphere. Our atmosphere is very thin, and it’s fragile, but it’s there – and tectonic plate movements help to regulate its makeup of gases as well as helping to regulate the planet’s near-surface temperature. This stunning image of the sunrise viewed from the International Space Station was taken by Canadian astronaut Chris Hadfield – it reveals the thin shell of our precious atmosphere covering the curve of the Earth.
  • The Earth possesses a magnetic field, which is generated because we have an inner core kept solid by the immense pressures at those depths, that rotates within a fluid outer core. The relative motion generates the magnetic field. This turns out to be far more important to life than simply providing a means of navigation. The central point here is that any charged particle moving through a magnetic field will experience a force. This is the same school-level physics that explains why an electrical current in a wire (which is another way of talking about the movement of electrons) can be used to create the motion of an electric motor if suitable magnets are place appropriately nearby. Thus, the Sun’s solar wind, which is largely made up of fast-moving charged particles, is mostly deflected around the Earth by this invisible shield and never reaches the surface. This is a good thing since energetic solar wind particles could have similar detrimental effects on living tissue as exposure to radiation. Furthermore, as Mercury, Venus and Mars tell us, the Solar wind is well-able to strip away the gas molecules that make up a planet’s atmosphere if they’re close enough to the Sun. (Venus retains a fairly dense atmosphere: it’s mass is high enough that its gravitational pull can, by and large, hang on to it – but its lack of a magnetic field means that measurable amounts of it are continually being stripped away from the planet.) 
Shields up! The two regions of the Earth’s atmosphere which do experience the effect of the solar wind are the poles. Here, the magnetic field lines dip down towards the north and the south poles, allowing charged particles to travel into the atmosphere. Collisions with oxygen and nitrogen molecules in the atmosphere give rise to the aurora. (The images above are from https://scijinks.gov/aurora/ and https://ase.tufts.edu/cosmos/view_picture.asp?id=356, left and right respectively. For a stunning view of the aurora, extending as though a coronet around the Earth, watch this video – shot from the International Space Station, or a slightly longer compilation of ISS videos here.)
  • The Moon is the fifth largest moon in the Solar System, and by far the most massive moon in proportion to its planet. Indeed, the Moon’s mass is a full 1.2% of the Earth’s. This might not sound a lot, but consider the solar system’s larger moons: they orbit planets that have far, far higher masses than the Earth. For example, Titan has more than three times the mass of the Moon but that still represents only 0.04% of the mass of its planet, Saturn. Thus, we have a moon that exerts a strong effect on our oceans, creating the tides. There is a more subtle element to our relationship with the Moon however: it is massive enough to stabilise the angle of tilt of our rotation. In other words, it stops us from ‘wobbling’ too much, thereby granting us long-term stability in terms for our climate’s seasons. The Earth spins at an angle of 23.5º. That’s what gives us our solstices and our beneficial seasons as any given region of the Earth’s surface will tilt towards or away from the Sun as its orbit (the year) progresses. This is a ‘middling’ value – Mercury’s is 0.03º whilst Uranus’ tilt is at 82.2º. However, more important for the emergence and sustainability of life is the fact that it doesn’t vary much. Compare this to Mars’ tilt, which shifts between 10º and 60º in timescales of a mere million years or so and thereby alters its climate fairly rapidly. It takes a proportionately big moon to be able to stabilise the tilt of its host planet in this way. 
  • There’s another consequence of the Moon’s large mass relative to the Earth which may well have an impact on tectonic plate movement. We naively think of the Moon orbiting the Earth in the same way as the Earth orbits the Sun, and in a sense it does. However, the physics of the situation tells us that whenever two bodies are tethered together – in this case via a gravitational force – they will rotate around their mutual centre-of-mass. In other words, both the Moon and the Earth rotate around this centre-of-mass, and it’s the centre-of-mass that orbits the Sun. I have tried to illustrate this in the simple diagram shown below. The fact that the Moon is massive enough to pull the Earth to and fro during each of the 28 days of the lunar month, albeit by a small amount, may well be important in terms of plate tectonics. 

An equal mass at either end of our beam means that the centre-of-mass – the balance point – must be in the middle of the rod connecting them. However, if one of the masses is only half the other then the balance point shifts towards the more massive end; the position of the centre-of-mass shifts along the rod in proportion to the masses. Now, the Earth is 81 times as massive as the Moon so, for the Earth-Moon system the centre-of-mass is actually within the Earth: about 1700 km beneath the surface in fact. This animation may help you to visualise what’s going on.

Thus, whilst there are undoubtedly many millions of planets even in our own galaxy, there are several important things that need to be in place before any of them could truly be called ‘Earth 2’. We inhabit an amazing planet that has nurtured life. It behoves us to treat it accordingly.

_________________________________________________________________
Postscripts

  1. Although drafted in the week prior to delivering my talk, I delayed publishing this post until afterwards ... just in case. It is for others to tell me whether I succeeded in conveying my passion as a non-expert scientist for this topic, but I must record my appreciation for the participants. There were some cogent and challenging questions posed throughout - the answers to some of which lay outside the bounds of my amateur understanding - and several genuinely helpful contributions. I got to 'talk science' and I came away having learnt something - I think that's called 'win-win'!
  2. This opinion piece in the Guardian newspaper (here, published several days after my talk and after this post was uploaded) perhaps adds fuel to the debate on whether we are 'alone' in the universe or not. You may have heard of the Drake Equation, which set out to quantify estimates for intelligent life existing other than on the Earth and concluded that there is likely to be many examples, even in our Milky Way. Enrico Fermi, a hugely important person in the annals of 20th century physics, articulated a paradox (e.g. see here): if there are so many civilisations out there why is it that we've seen precisely none?  The Guardian's opinion piece reflects on this.


Friday, 13 April 2018

That Which We Call A Scientist


When I first conceived this blog, more than fifty posts ago, I set myself a limited number of goals. In essence, my aim was to try to encapsulate a lifelong love for the sciences by reflecting on some of the things that I do and experiences I have had in its pursuit; thereby, or so I hoped, others might be drawn by my passions. There was a self-centred motivation as well: I enjoy the process of writing; it helps me sort out my thoughts and make a little more sense of who I am and what I am doing. Were I not writing for myself, at least in part, it is doubtful that the blog would have continued for very long.

Given that I am no longer paid as a full-time professional scientist, having ‘retired’ from my former post as Professor of Materials Physics a couple of years ago, my contact with ‘things scientific’ has changed. There is some reflection of this in the previous post, here. However, this new vantage point has brought something into focus that relates to my blog’s original objectives but which I haven’t considered in a direct fashion hitherto*. My posts have, by design, omitted swathes of day-to-day life – even when events within it had a direct impact on being a scientist. That phrase, ‘being a scientist’, is at the core of the blog’s raison d’être but the emphasis has never rested on the word ‘being’. Thus, in this particular post I have decided, albeit in a generic rather than an overtly personal sense, to offer a reflection on that which links ‘being a scientist’ into the warp and weft of humanity.

Where better to start than with the thoughts of a couple of William Shakespeare’s characters. The very title of this post is an adaptation of lines spoken by the young Juliet in his Romeo and Juliet:
“What’s in a name? That which we call a rose, by any other name would smell as sweet; so Romeo would, were he not Romeo called.”
More powerful, I think, are the haunting lines spoken by Shylock in The Merchant of Venice as he highlights a particular mindset within his society (- endemic religious prejudice against Jews in his case); I have edited in the title ‘scientist’:
“Hath not a scientist eyes? Hath not a scientist hands, organs, dimensions, senses, affections, passions? Fed with the same food, hurt with the same weapons, subject to the same diseases, healed by the same means, warmed and cooled by the same winter and summer …? If you prick us, do we not bleed? If you tickle us, do we not laugh? If you poison us, do we not die?”

The point of all this is to lay claim to the fact that a scientist isn’t particularly ‘special’ in a qualitative sense. Were I a sporting person, a bricklayer, a nurse, a priest or a farmer I might therefore also write an analogous post on this theme – but I’m none of those things: I happen to have enjoyed a career in science. Scientists are neither sub-human nor super-human. This might seem self-evident; it should be self-evident. However, I have met and/or witnessed enough examples of scientists being stereotyped towards one end or the other of an imagined spectrum to know that bias, unconscious or otherwise, is far from uncommon. In truth, bias is endemic. We all suffer from it in multiple ways: it’s important to realise that it’s present since awareness can be an important form of mitigation against its effects.

Thankfully, I’ve no personal experience of being labelled a genius, and my entire career has been enriched by the joy of never having worked solo, but both labels may become attached to scientists as a way of categorising them. There was a time, particularly during the later decades of the last century, when I felt nervous about admitting in a social setting that I was a physicist: the development of nuclear weaponry, and many evils besides, might be laid at my feet by the proverbial prosecution. My protestations of innocence weren’t always effective. A little easier to handle are the often diffuse exclamations that emerged from an ill-defined, even visceral, school-induced fear of science – and physics in particular. In such situations the conversation could convulse to a rapid end without prompt intervention. I often respond by admitting that science is pretty much the only thing I’m any good at, and it’s usually safe to add that I couldn’t do what they do – whatever that is – even if I had another lifetime in which to try. We are each valuable for who we are, not for what we do. (In passing, I can't help but quote a favourite line from the recently-released movie Isle of Dogs, spoken by a student to a character called Yoko Ono: "Pull yourself together, remember you're a scientist!)

So, Doctor Who or Doctor Strangelove: shall we adopt a caricature? We so easily slip into stereotypes, but Juliet and Shylock both offer a better approach. I value and enjoy my ‘life scientific’, I always have, but I’m neither an evil genius nor a hero. I have been ecstatic at new birth and felled by bereavement, I suffer the same sorts of physical and mental illnesses as others; I love, enjoy, dislike and hate; I succeed and I screw up; I have insight and I’m in a fog; I disbelieve and I have faith; … just like you.

Images: https://www.youtube.com/watch?v=ozg7gEchjuM and https://www.theguardian.com/tv-and-radio/2017/nov/09/doctor-whos-hardest-task-yet-making-yellow-braces-happen

________________________________________________________
* I recall, and with a smile on my face as I type, that during one incarnation of my research team (in the ‘90s as I recall) I was forbidden from using the word ‘hitherto’. I had evidently used it so frequently that it had become an annoyance. There’s no-one to stop me now ;-)
________________________________________________________
Postscript: There may be a sense in which this post and the one that preceded it by a week marks a point of change in this blog. Given the reduced rate at which ‘things scientific’ present themselves within my life, I wonder about allowing it to come to an end – or perhaps simply to rest it for a while. An alternative would be to allow the contents of any future posts to drift from my initial vision into new areas. We shall see; I have come to no conclusions. The default will be to ‘rest’ it and then to see whether anything new comes along or to mind that I feel compelled to write about. Of course, if the rest goes on for long enough it will become indistinguishable from closure …


Saturday, 31 March 2018

Tapering: towards an end, a beginning


It was about four years ago that I began to taper, flexibly. What has been surprising in certain respects is the nature and duration of the taper, with a corresponding joy emerging from the serendipity of the new. In this post I try to reflect upon the transition from full-time academic scientist into a ‘freelance’ scientist who is developing other interests, and the extent to which echoes from the former are still being enjoyed.

For very positive personal reasons, and after a cluster of re-alignments in research activity (e.g. here) and sensing a reduced scope for further innovations in teaching (e.g. here) I decided to become my university’s ‘guinea pig’ within a new scheme for ‘flexible retirement’. It worked well in terms of re-balancing my week and seemed a sensible initial step towards an eventual retirement in the more conventional sense of the term. Thus, for approximately 18 months I drew a fraction of my university salary and a complementary fraction of my pension. The eventual decision to retire from my post completely arose fairly organically from this interim stage. However, the final step brought with it at least one surprise – on the day of the retirement celebration planned by friends within my department. Catering had been organised, invitations sent out and I had begun to steel myself for the necessarily emotional aspects of the event. However, a police-issued order for a lock-down intervened: someone had called them with a (hoax) bomb threat. So no catering, and half my university friends/colleagues were locked in their own buildings; even my wife was stuck at a road block and unable to enter the campus. A kind soul remembered that there were some crisps (potato chips for those in the USA) and peanuts left over from a student reception the previous day, and the residual tea/coffee was augmented by the generous gift of a few bottles of wine which happened to be in the Head-of-Department’s office. I made a few impromptu remarks – my remarks tend to be impromptu – about how life is made of relationships, and that it would be the people I would miss the most: which I meant, and still do. Once the cordons were lifted, we all went our respective ways. I was retired.

Here, at the end of all things (Image adapted from https://imgur.com/gallery/OOTGg, with creative appreciation also to JRR Tolkien and to Peter Jackson. Feel free to interpret the image in light of my chosen title to whatever degree you believe is appropriate. For my part, ‘beginning’ is the title’s keyword: I simply wanted to be able to show an image that had about it a sense of ‘tapering’ from one state into another.)

In the two and a half years since that ‘interesting’ day I have accumulated abundant evidence of post-retirement opportunities – those utilising my disposition as a scientist as well as those in wholly new areas. I’ve reflected on this before, e.g. here, here and here. However, what was only partly anticipated at the time was the extent to which my former professional life as an academic teacher and researcher would roll forwards for as long as it has. The motivation for uploading this post derives from the fact that I seem to be approaching the point at which I can declare that I have indeed ‘cleared my desk’ in the metaphorical as well as the literal sense. Even my agreement, more than a year after retiring, to write the inaugural post for my Department’s new blog seemed to symbolise the extended process of tidying up. (Here, in its original form.)

One specific component to the pre-retirement discussions with my Head of Department involved an agreement to return for the Spring teaching term following my Autumn retirement date in order to teach a particular 24-lecture module. This would enable the Department more gradually to bring recently appointed early-career colleagues into play. I was content to do this; it was understood to be a one-off ad hoc arrangement with a specific and well-defined objective. Teaching undergraduate Physics students thereby ended completely a mere six months after I had retired. Defining an end to my former research endeavours is nowhere near as straightforward.

Setting aside the glorious-but-hard-to-cope-with day, about seven months after the date of my formal retirement, on which many colleagues and friends came together in generous celebration of my career (here) there have been references to write for former members of my research team as they move from success to success, and continuing to act as a sounding board for those colleagues I was privileged to mentor. I’ve also had a sprinkling of other ad hoc tasks associated with my career-long support for the UK’s major research facilities. Rather more extensive has been the effort to realise my hope to see any significant residual hard-won data analysed, interpreted and submitted for publication. This is not only of intrinsic professional importance to me and my former team members but there is, in my opinion, an ethical need to make sure that the publicly-funded research we undertook is properly peer-reviewed and openly published insofar as we are able to do so. The difficulty, and at the same time, the pleasure, of trying to move forward on this is that it depends crucially on those research scientists with whom I undertook the experiments in the first place. It has been a delight to have seen four post-retirement journal papers emerge thus far, and to know that the fifth – and probably final – manuscript was accepted for publication just a few hours before this very post was uploaded. Interestingly, this final paper is both the longest in terms of pages of text and the oldest in terms of the date at which the data was gathered. It relates to a hugely ambitious experiment a colleague (Jacqui Cole) and I conducted in the USA which yielded a complex set of data on rare earth glasses in need of a novel and bespoke approach to its analysis. It has taken us more than a decade to complete the task, even with invaluable input from a couple of talented early-career researchers. Out of the results of our work I will also be able to present a paper at the annual conference of the Society of Glass Technology in September (abstract here). Will the taper in post-retirement research activity conclude at that point? I’m working on the basis that it will, but I have learnt to hold such conclusions lightly. 
Heuristic diagram of the local atomic structure in a rare earth glass.
There is a postscript: ‘freelance research’ has yielded some unexpectedly sweet fruit. I have had the opportunity, since I retired, of contributing in a small way towards the conservation of the stained glass at Canterbury Cathedral (see here) and of contributing to the study of star-forming regions in our galaxy (see here). I presented the glass conservation issues at a conference eighteen months ago, and a manuscript derived from the ‘citizen-science’ observational astronomy project has recently been submitted for publication. Science goes on, as it surely must. I am delighted to be a part of that process even now, albeit in an increasingly novel guise as time passes. I am also pleased to be able to confirm that new outlets for creativity, outside of the conventional boundaries of ‘science’, have readily emerged in order to enrich life.

Young stars don’t collect additional matter from the surrounding disk at a uniform rate. A given star may have periods when its brightness increases quite significantly because the rate at which it is accreting new matter from the surrounding disk has increased markedly. There are theoretical models for all this, but a lack of data. This is where the citizen science project came in. (Image adapted from http://sciencewise.anu.edu.au/articles/accretion)


Friday, 23 March 2018

Pick a Scale


Back in time, when I was still a salaried academic, one of the students in the course on Matter I taught [1] managed to derive a novel form of creativity from my lectures. I habitually made audio recordings – later, video recordings – of my lectures available to students for revision purposes (and to help with dyslexia etc; see here and other related posts) but this one student found another use for them. He cut snippets from my lecture recordings and dubbed them onto a piece of music. I only found out about it after it had travelled, viral fashion, around the student body. I took it as a compliment, and still do. In order that you can enjoy this as well I've uploaded it to YouTube, here: it benefits from volume and decent bass [2]. One of several things I learnt from his creativity is that I had, and most probably still have catch-phrases. There was one, however, that almost certainly led the pack in the context of this lecture course: “pick a scale” and its close variants.

Why? Because the most common cause of needless mistakes within their numerical exercises was the admixture of measurement scales and a confusion regarding the units associated with a given scale. Thus, someone might mix grams with kilograms and be out by a factor of 1000 – make this mistake more than once in a calculation, or do so in the context of an equation in which the mass, for example, appears more than once, and the results will be thrown even wider off the mark. It was a problem that dogged the students in this programme more than most simply because they were often older than the usual direct-entry undergraduates and/or came from a wider range of educational backgrounds. Many of them had, like me, grown up with measurement scales and units that were commonly used before SI units, the système international d'unités, held sway as our metric framework.
A ‘useful’ plastic ruler from my past: upper scale showing centimetres and their metric sub-division into millimetres; lower scales showing inches and subdivisions into tenths, twelfths and sixteenths.
Within my own formal education I had begun with imperial units (miles, feet & inches; pounds, hundredweight and tons; hours; degrees Fahrenheit …) and all the derived units that went with them or alongside them – like foot-pounds to quantify energy and pounds per square inch as the unit of pressure. Many of us in the UK will still think in those terms on a day-to-day basis; many more in the USA will follow suit. I was versed in these things until my mid-teens; even the wicket on the cricket pitches my father and brother played on, and my son still does, are precisely one chain long (stumps to stumps; one chain = 22 yards = 66 feet). However, by then I was veering towards the sciences, and therefore also mathematics, and metrication became the thing – we were required to familiarise ourselves with the CGS system: centimetres, grams and seconds, and associated units like degrees centigrade. We were obliged to change yet again within two or three years. By then I was in the final stages of my secondary schooling – senior years of High School within the USA, approximately – and had opted to specialise solely in the physical sciences. (I specialised because that was what one did back then, and it remains the norm in England today unfortunately. By preference I would have added English Literature and either Archaeology, Logic/Philosophy to the mix.) This time it was a blessedly less radical move into the MKS system: metres, kilograms and seconds, and their associated units. The final change, or at least I hope and believe it’s the final one, came when I became an undergraduate Physics student: MKS moved almost effortlessly into the SI system, which retains the same base units of length, mass and time.
My wife still uses these imperial-scale scales in the kitchen, as do I when following classic old recipes – particularly for jam (or jelly for those in the USA). The mass currently on the scales is one pound (1 lb); the others shown are ½ lb, 4 ounces (4 oz, i.e. ¼ lb), 2 oz and 1oz.
Thus, I could empathise with my students because I had seen even larger shifts in the way we quantify our measurements of our world than they had. However, empathy alone was of little benefit to them – hence the need for many reminders to make sure all the numbers they were using were associated with the same measurement system, preferably SI: whence was born a catch-phrase …

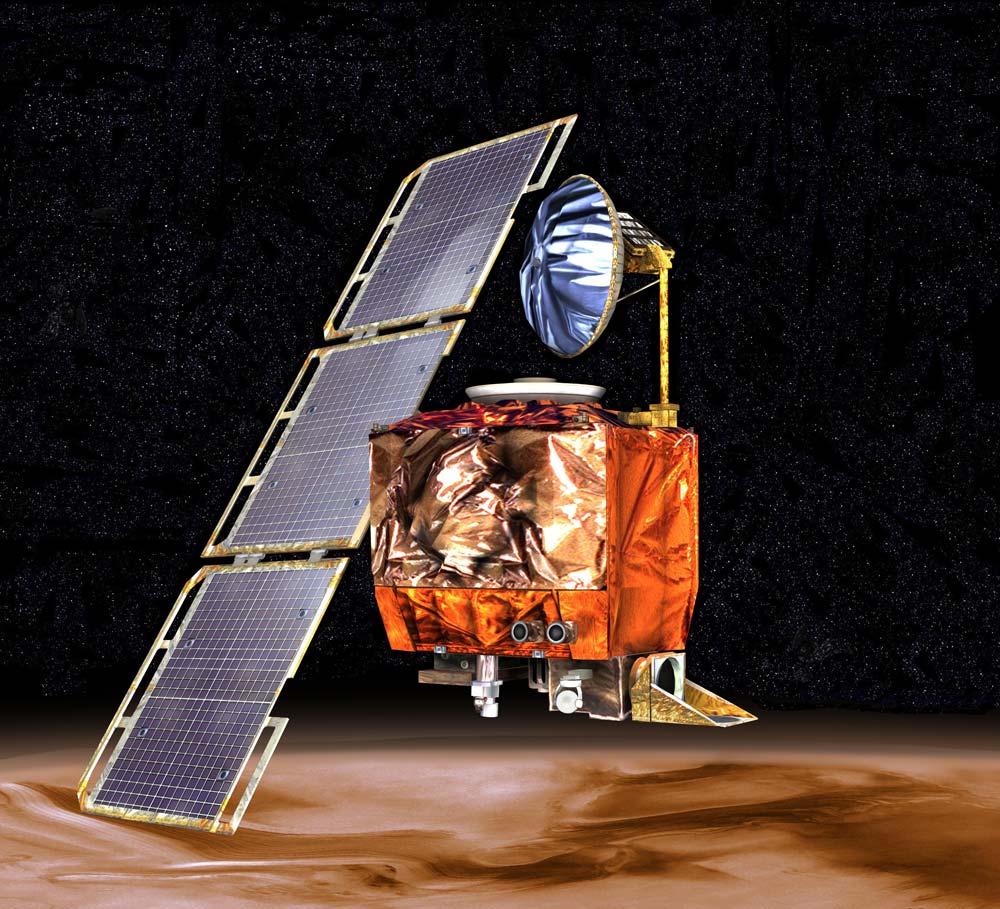
Lest anyone think this is an issue of minor irritation to a few early-years students, I’ll share with you the story of NASA’s $125M Mars Climate Orbiter from the late ‘90s. It burned up in the Martian atmosphere because engineers had failed to convert units from imperial to metric (see here). To bring it forward to today, just imagine the consequences of an analogous error in the software of a driverless vehicle. Scales and units are a non-trivial issue.
Mars Climate Orbiter 
Nothing in what I have said should be taken as a statement that the scales and units of former days were intrinsically inferior. I habitually use the metric system – almost always the SI – because it makes my life easier, both as a scientist and when in the kitchen or at my workbench, but these other scales have their strengths. Imperial scales are often quite intuitive for instance: a foot corresponds to just that – the average length of an adult foot, and an adult’s stride becomes a yard; the acre, a measure of area, was defined in terms of the farmland that might reasonably be ploughed in one day prior to mechanisation. The Fahrenheit scale, likewise, was established such that 0ºF corresponds to the lowest temperatures one might expect in Winter (- bearing in mind the parts of the globe in which the scale was being used) and 100ºF to the highest Summer temperatures to be expected. It’s all very sensible as far as it goes. Moreover, even now, and amongst a scientific community using SI units by default, there are ‘useful exceptions’. Astronomers and planetary scientists speak in terms of the astronomical unit, AU, for example, which is simply the average Sun-Earth distance; mass is often given in units of Earth’s mass or the Sun’s mass. Closer to home, although I perhaps ought to be employing the nanometre, nm, I still use a length called the Ångström when I’m discussing the separations between atoms: this was initially established as the diameter of a hydrogen atom – the smallest atom and therefore a useful ‘measuring stick’ in this realm. There are 10 Å in each nm.

For a useful compilation of scales and units, old and new, see here.

An obvious weakness in the historical scales, certainly as they were originally established, is that they could – and did – vary quite markedly from one community to another, much as the time of day varied within a country when all calibration derived from the Sun. Even after standardization was achieved there remained significant issues, not least with the English-speaking world. For instance, a gallon in the UK is not the same volume as a gallon in the USA: in fact it’s approximately 20% larger. However, these are well understood differences. More troublesome by far, to my mind at least, are those ad hoc scales/units invented ostensibly to help us understand something but which serve only to obfuscate and confuse. There is a depressingly long list of examples: measuring an area using a ‘football pitch’ as the unit, or a height in terms of Nelson’s Column in London, or a length in units of London buses, … My personal ‘favourite’, which I spotted in one of my grandsons’ books a few years ago, came from an author trying to convey the mass of one of the monoliths which make up Stonehenge by informing us that is was the same as 22 sheep! I can’t help but think that these inventions are counter-productive.


Footnotes
[1] I was teaching this within our Foundation Year programme which I helped to start back in the early ‘90s. The programme, inserted before the more conventional undergraduate degree programme, has offered a ‘second chance’ to hundreds of students in the succeeding years. I loved teaching within it, and the students I met whilst doing it.
It’s amusing to see that the lead text at the top of the current web page still has its roots in what I wrote for printed course booklets back then: this Physics evidently ages well.

[2] The music is Tractor Beam by Eat Static, which is used with their kind permission; the image is of Bulkhead by Rick Kirby and this stands outside the Marlowe Theatre, Canterbury, UK.

Image of Stonehenge adapted from http://www.english-heritage.org.uk/visit/places/stonehenge/ and the cartoon sheep are extracted from http://clipart-library.com/clipart/1686234.htm